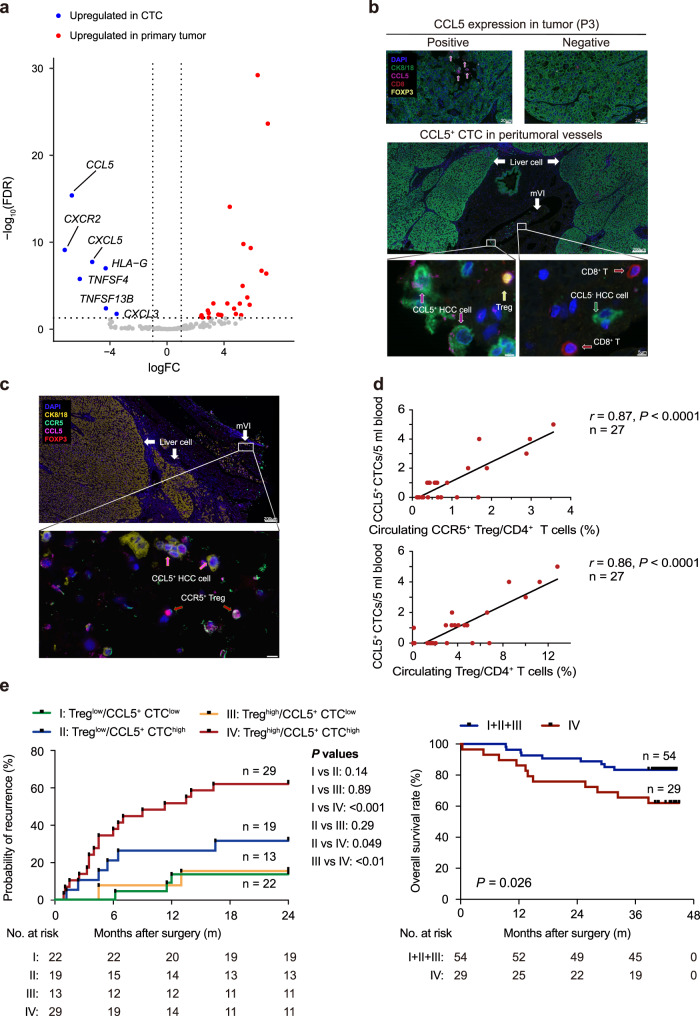
Fig. 4. CCL5+ CTCs are positively correlated with circulating Tregs and predicted postoperative relapse in HCC patients.
a Immune-evasion-related genes and cytokines differentially expressed by CTCs and primary tumors. b Multiplex immunofluorescence images displaying the expression of CCL5 in primary tumors and CTCs detected in peritumoral microvasculature. mVI, microvascular invasion. The scale bars represent 20 µm, 200 µm, and 5 µm, respectively. c Multiplex immunofluorescence images representative of spatial relationship between the CCL5+ CTCs and CCR5+/FoxP3+ Tregs detected in peritumoral microvasculature. The scale bars represent 200 µm and 10 μm, respectively. d Scatterplot showing a positive correlation between the number of CCL5+ CTCs and the abundance of CCR5+ Tregs (CD4+, CD25high, and CD127low) (upper) and total Tregs (lower) in CD4+ T cells from HCC peripheral blood (n = 27 patients). e Kaplan–Meier analysis showing increased probability of early recurrence (left) and decreased overall survival rate (right) in patients with Treghigh/CTChigh in peripheral blood vs the other groups. I: Treglow/CCL5+ CTClow, II: Treglow/CCL5+ CTChigh, III: Treghigh/CCL5+ CTClow, and IV: Treghigh/CCL5+ CTChigh. The number of patients at risk for each group is listed below the Kaplan–Meier curve. A two-tailed Student’s t test was employed (d). Log-rank testing are performed to estimate the prognostic significance (e).

