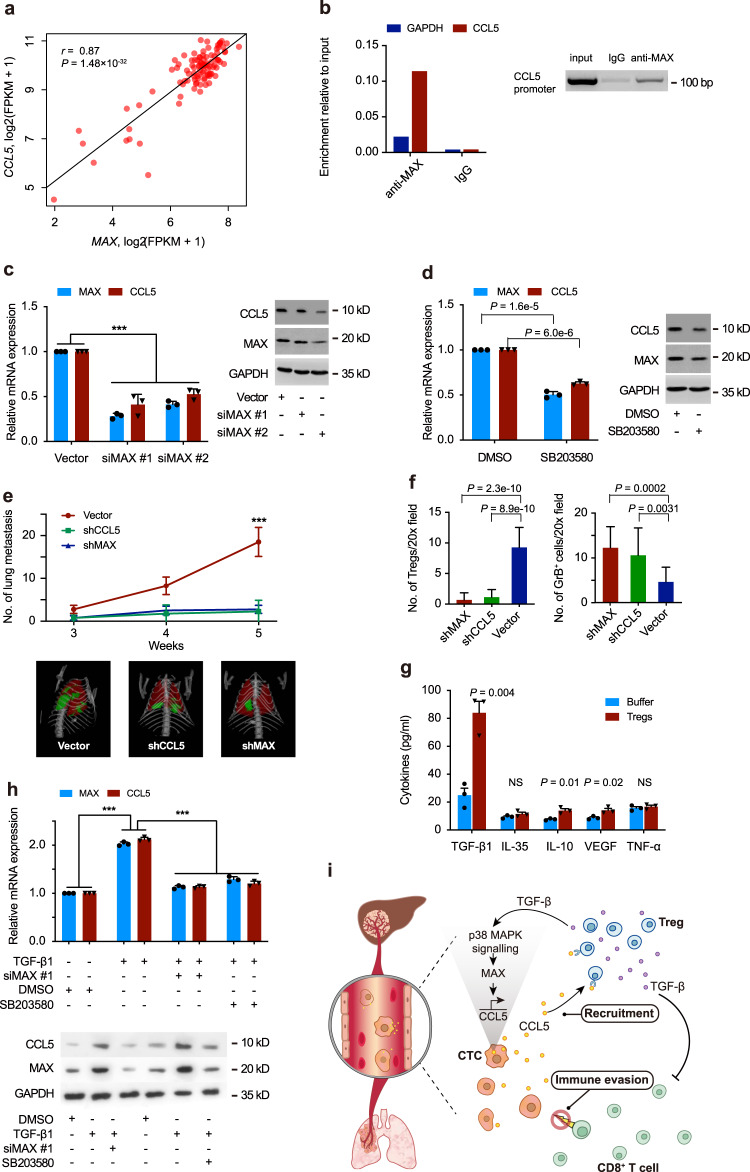
Fig. 6. CCL5 induction is mediated through p38-MAX pathway.
a Scatterplot showing a high correlation between CCL5 and MAX expressed in CTCs based on scRNA-seq. A two-tailed Pearson correlation test was employed. b ChIP assays showing direct binding of MAX to the CCL5 gene promoter in MHCC97H cells, using IgG as negative control. c Relative expression of MAX and CCL5 at mRNA (left) and protein level (right) in MHCC97H cells transfected, respectively, with MAX siRNAs and vector, and d treated with p38 inhibitor SB203580 or DMSO control. e The number and representative images (metastatic nodules in green) of lung metastases detected by microCT in different time points after tail-vein injection of 5 × 10⁶ Hepa1–6 cells with three different conditions in C57BL/6J mice (n = 5 per group, upper panel). f Histograms showing the numbers of Tregs (left) and granzyme B+ cytotoxic T lymphocytes (right) in lung metastases from mice treated, as described in e. Five independent microscopic field, representing the densest lymphocytic infiltrates, were selected for one lung metastatic tumor each mouse. g Comparing levels of Treg-derived cytokines, including TGF-β1, IL-10, IL-35, VEGF, and TNF-α in culture medium from Huh7 cells cocultured with or without Tregs: error bars. h The mRNA (upper) and protein (lower) levels of MAX and CCL5 in MHCC97H cells treated with TGF-β1, MAX siRNA, P38 inhibitor, and DMSO, respectively. i Schematic illustration of immune-escape mechanism by which CTCs acquire the ability to recruit immunosuppressive Treg cells via a positive feedback loop of TGF-β1-p38-MAX-CCL5 signaling, consequently promoting the formation of a metastatic-favorable microenvironment in the bloodstream and secondary organs. Comparisons were calculated by two-tailed Student’s t test (c–h). Data are mean ± SD of three biological (c, d, g, h) and five biological (e) replicates, and are representative of two independent experiments. *** represents P < 0.001. The exact P values for comparison of MAX expression in c: vector vs siMAX#1, P = 2.00 × 10⁻⁶; vector vs siMAX#2, P = 8.96 × 10⁻⁴. The exact P values for comparison of CCL5 expression in c: vector vs siMAX#1, P = 8.00 × 10⁻⁶; vector vs siMAX#2, P = 1.51 × 10⁻⁴. The exact P values at the time point of 5 weeks in e: vector vs shCCL5, P = 2.8 × 10⁻⁴; vector vs shMAX, P = 1.1 × 10⁻⁴. The exact P values for comparison of MAX expression in h: DMSO vs TGF-β1, P = 2.00 × 10⁻⁶; DMSO vs TGF-β1 + siMAX#1, P = 8.00 × 10⁻⁶; DMSO vs TGF-β1 + SB203580, P = 5.00 × 10⁻⁵. The exact P values for comparison of CCL5 expression in h: DMSO vs TGF-β1, P = 2.00 × 10⁻⁶; DMSO vs TGF-β1 + siMAX#1, P = 5.00 × 10⁻⁶; DMSO vs TGF-β1 + SB203580, P = 1.8 × 10⁻⁵.

