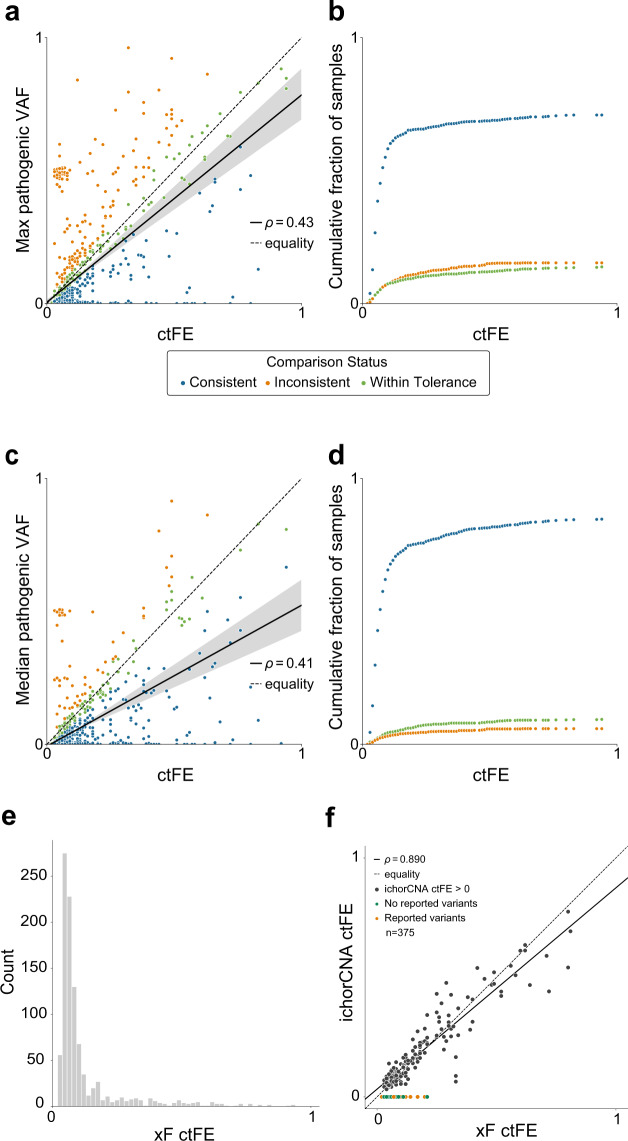
Fig. 2. Circulating tumor fraction estimate (ctFE) and variant allele fraction (VAF).
ctFE of xF-sequenced patients (n = 1000) shows a modest correlation with max pathogenic (a) and median (c) VAF (ρ = 0.43 and 0.41, respectively) even after removing likely germline variants and variants that fall within an amplified region of the genome. A variant can be detected at or below the tumor fraction of the sample, so if the detected VAF was less than the OTTER ctFE it was considered consistent (blue). If the maximum or median VAF was within ±20% of the relative OTTER ctFE, or an absolute 0.02 of the fraction, then the sample was considered within tolerance (green). If the detected VAF was greater than the OTTER ctFE it was considered inconsistent (orange). b, d Cumulative fraction of samples with consistent VAF and OTTER estimates of tumor fraction as the ctFE increases. Overall, 84.7% of samples had OTTER ctFEs within tolerance or consistent with the maximal VAF detected in the sample (b). Overall, 94.1% of samples had OTTER ctFEs within tolerance or consistent with the medial VAF detected in the sample (d). e The distribution of ctFE across the cohort (median ctFE = 0.07, mean ctFE = 0.12, SD = 0.15). f In samples that also underwent low-pass whole-genome sequencing (LPWGS, n = 375), ichorCNA detected tumor fraction in just 165 samples (black). Among those samples, there was a strong correlation between LPWGS-predicted tumor fraction and OTTER ctFE (ρ = 0.890). In the majority of samples (60%, orange) with no ctFE detected by IchorCNA, we also detected a variant using the xF assay, indicating that there was detectable tumor DNA and the ichorCNA estimate was a false negative.

