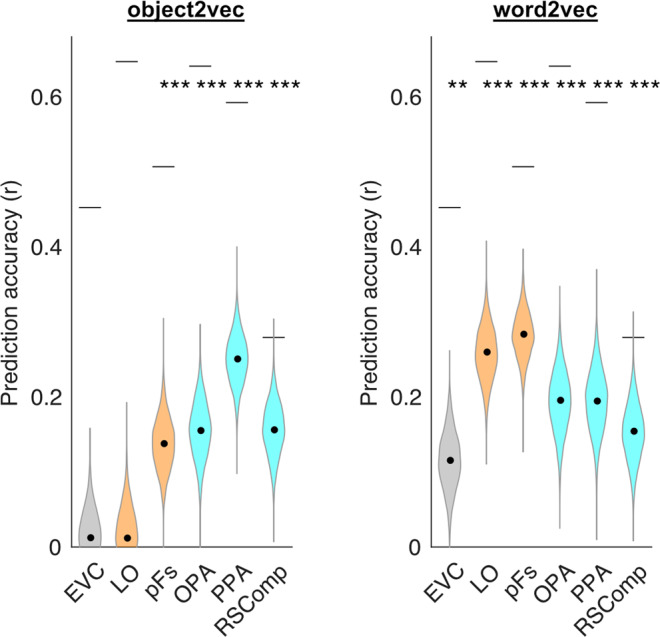
Fig. 5. Encoding models of visual and linguistic context predict fMRI responses to objects in functionally defined ROIs.

This plot shows the average prediction accuracies for encoding models in voxels from multiple regions of interest using either image-based object2vec representations as regressors or language-based word2vec representations. Object-selective ROIs are plotted in orange and scene-selective ROIs are plotted in cyan. The violin plots show the mean prediction accuracies (central black dots) and bootstrap standard deviations. The gray lines above each violin plot indicate the average voxel-wise split-half reliability of the fMRI responses in each ROI. The highest prediction accuracy for object2vec was in the PPA, whereas the highest prediction accuracy for word2vec was in LO and pFS. EVC early visual cortex, LO lateral occipital, pFs posterior fusiform, OPA occipital place area, PPA parahippocampal place area, RSComp retrosplenial complex. **p < 0.01, ***p < 0.001, uncorrected, one-sided permutation test. Exact p-values for object2vec: EVC p-value = 3.8e−01; LO p-value = 4.0e−01; pFs p-value = 8.0e−04; OPA p-value = 4.0e-04; PPA p-value = 2.0e−04; RSComp p-value = 2.0e−04. Exact p-values for word2vec: EVC p-value = 2.4e−03; LO p-value = 2.0e−04; pFs p-value = 2.0e−04; OPA p-value = 2.0e−04; PPA p-value = 4.0e−04; RSComp p-value = 2.0e−04. Source data are provided as a Source Data file.
