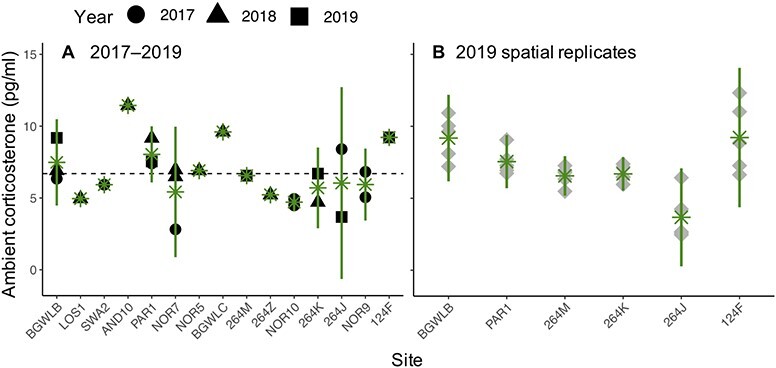
Figure 2.

(A) Ambient CORT (pg/ml) detected in wetlands in 2017–2019. Green asterisks indicate means (+/−95% confidence intervals) for wetlands sampled in multiple years (e.g. BGWLB), or multiple times within years (e.g. NOR9), or both (e.g. NOR7). For 2019, when we collected spatial replicates within each wetland to assess variance, only mean values are presented. The dotted line indicates the grand mean among all wetlands and years. (B) Ambient CORT detected in six wetlands sampled at five points evenly around the wetland perimeter in 2019. Green asterisks indicate means (+/− 95% confidence intervals) within each wetland.
