
Figure 2.
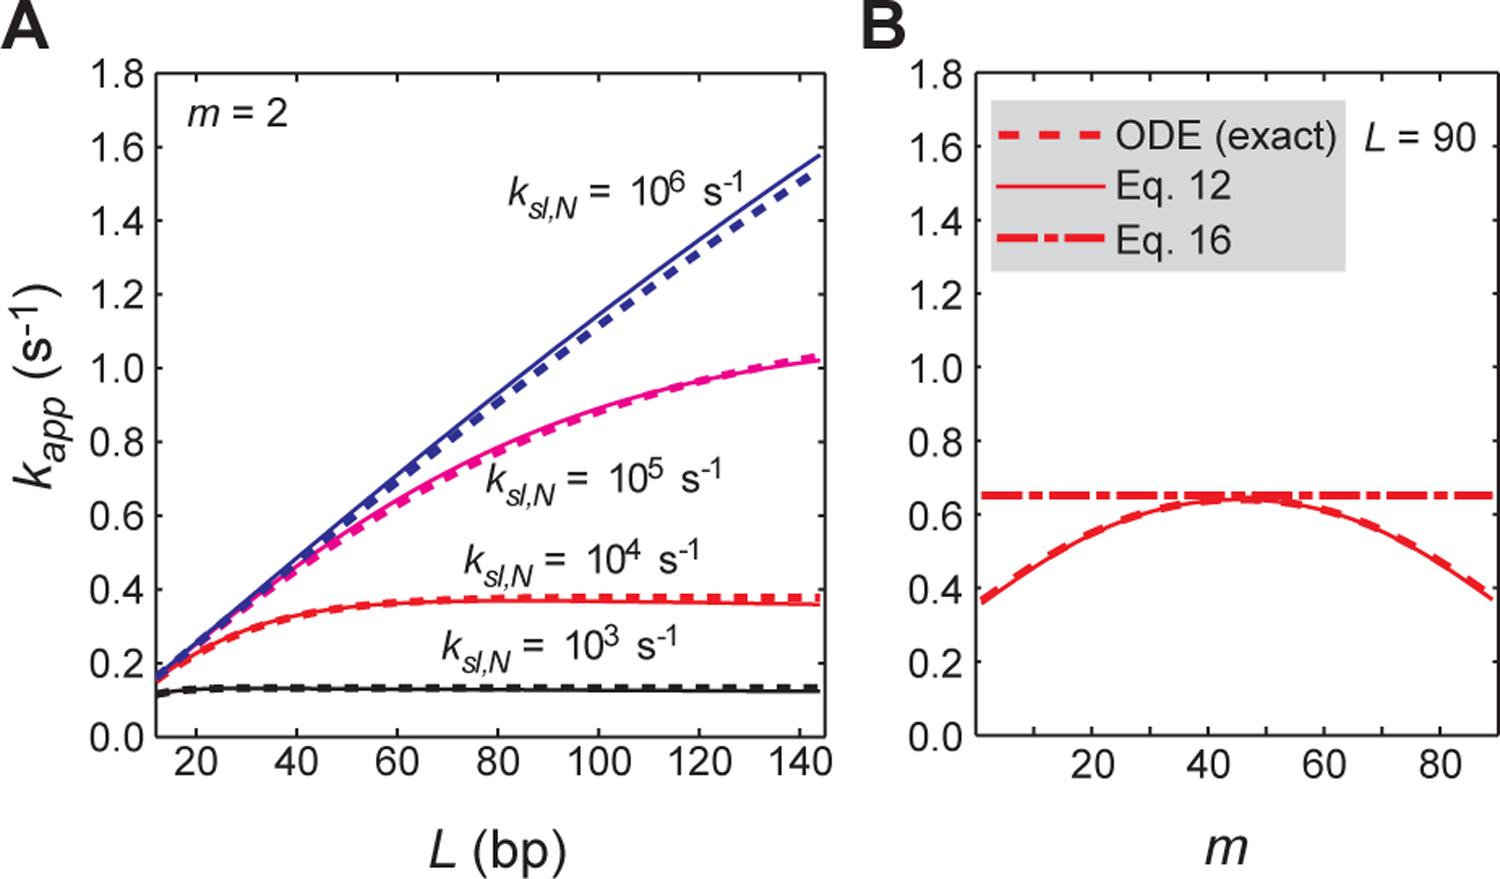
Validation of the VK model-based analytical form of kapp (Eq. 12) for systems involving competitor DNA but with no intersegment transfer. (A) Rate constant kapp for target association as a function of the total number of sites L. The position of the target was set to m = 2. The dashed lines were obtained from the ODE-based numerical kinetics simulations. The solid lines were obtained using Eq. 12. ksl,N = 103, 104, 105, and 106 s−1 and koff,N = 10 s−1 were used. Under these conditions, effective sliding lengths λ are 10 (black), 32 (red), 100 (magenta), and 316 (blue) bp. (B) Rate constants kapp as a function of the target position m for probe DNA with L = 90. For this panel, ksl,N = 104 s−1 and koff,N = 10 s−1 (an effective sliding length λ = 32 bp) were used. The dotted line is from the ODE-based numerical simulations; the solid line, from the VK model-based analytical form of kapp (Eq. 12); and the dashed line, from the modified Berg’s approximation (Eq. 16). For both panels A and B, Dtot = 2.5 nM; Ptot = 50 nM, Kd,N = 4 μM; Kd,S = 0.1 nM; Ctot = 2 μM; ϕ = 1; and M = 20.