
Figure 5.
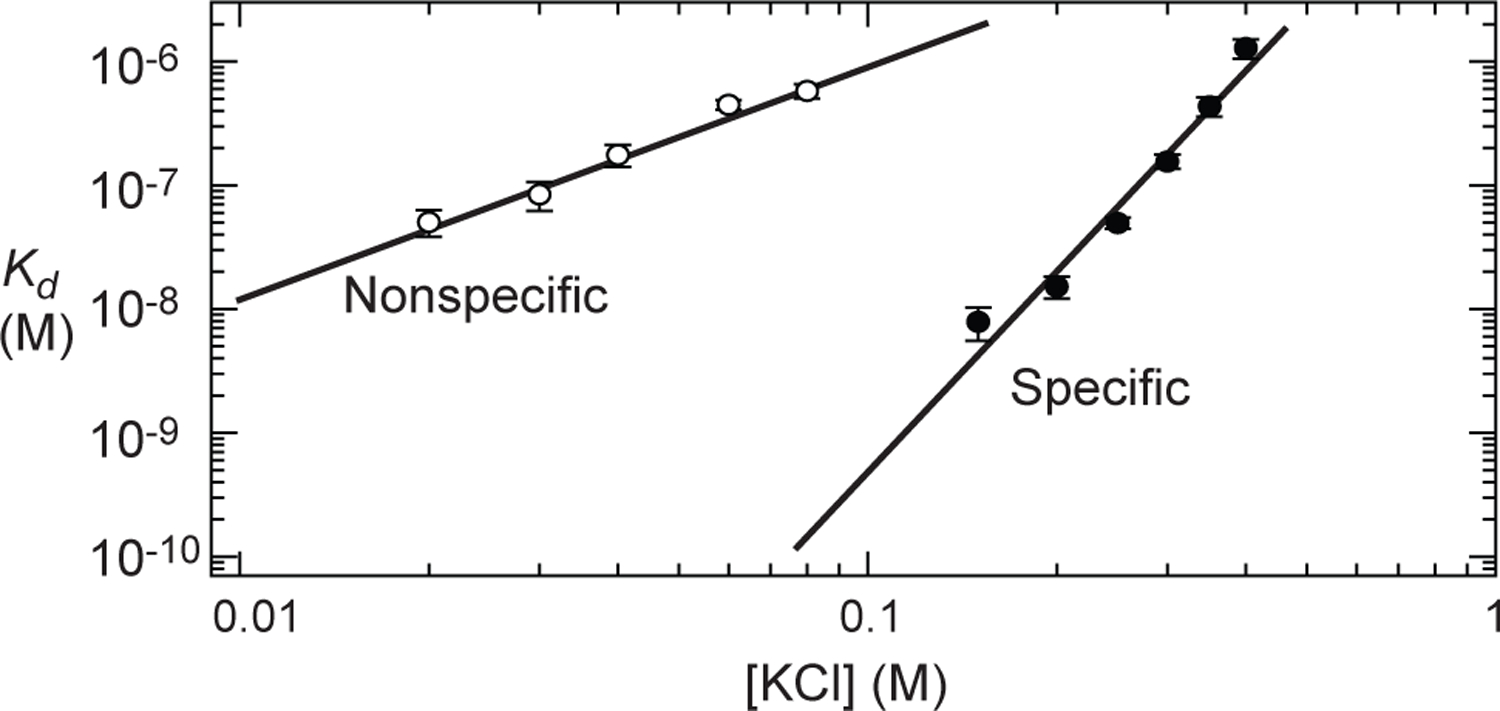
Dissociation constant Kd for nonspecific and specific complexes between the Egr-1 protein and 12-bp DNA at various concentrations of KCl. These data were obtained by measuring the TAMRA fluorescence anisotropy as a function of protein concentration. For each complex, the solid line represents a linear extrapolation assuming a linear relationship (solid lines) between logKd and log[KCl], which is based on the counterion condensation theory.52,53