
Figure 6.
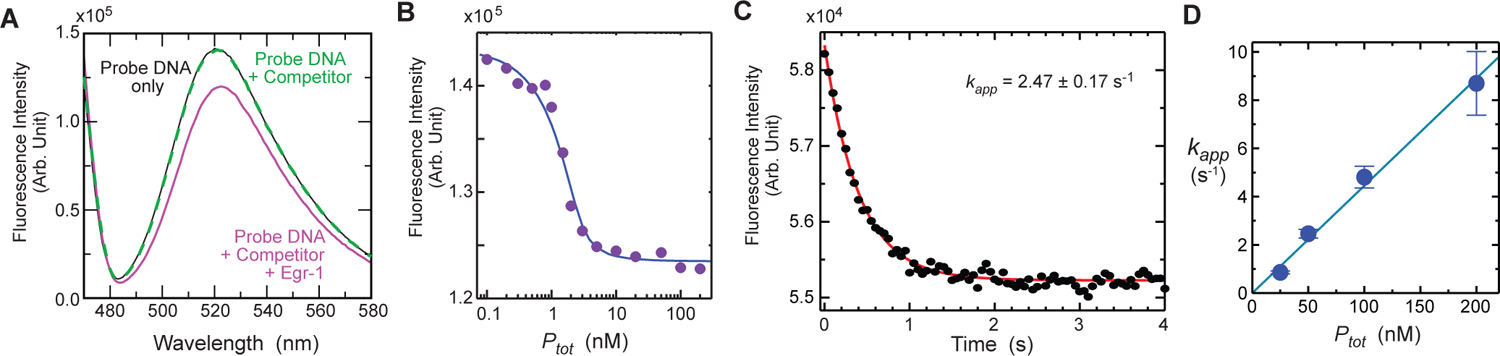
FAM fluorescence data for the target association of the Egr-1 zinc-finger protein with the 113-bp probe DNA (Dtot = 2.5 nM) in the presence of 28-bp competitor DNA (Ctot = 2 μM). The buffer conditions were 10 mM Tris•HCl (pH 7.5), 80 mM KCl, and 200 nM ZnCl2. (A) Change in the FAM emission spectra upon protein binding. The black solid line is the spectrum recorded for the probe DNA only; the green dotted line, for the probe DNA plus competitor DNA; and the magenta solid line, with the probe DNA, competitor DNA, and protein (Ptot = 100 nM). (B) FAM fluorescence intensity measured as a function of Ptot in the presence of the competitor DNA. (C) Stopped-flow time-course data of the FAM fluorescence intensity immediately after mixing the protein solution (Ptot = 50 nM) with the solution containing the probe and competitor DNA duplexes. The red curve represents the best fit to a mono-exponential function. (D) Protein-concentration dependence of the apparent pseudo-first-order kinetic rate constant kapp for target association. The apparent second-order rate constant for association was determined to be 4.5 × 10⁷ M−1 s−1. The error bars represent the standard deviations for 8 – 10 replicates.