
Figure 7.
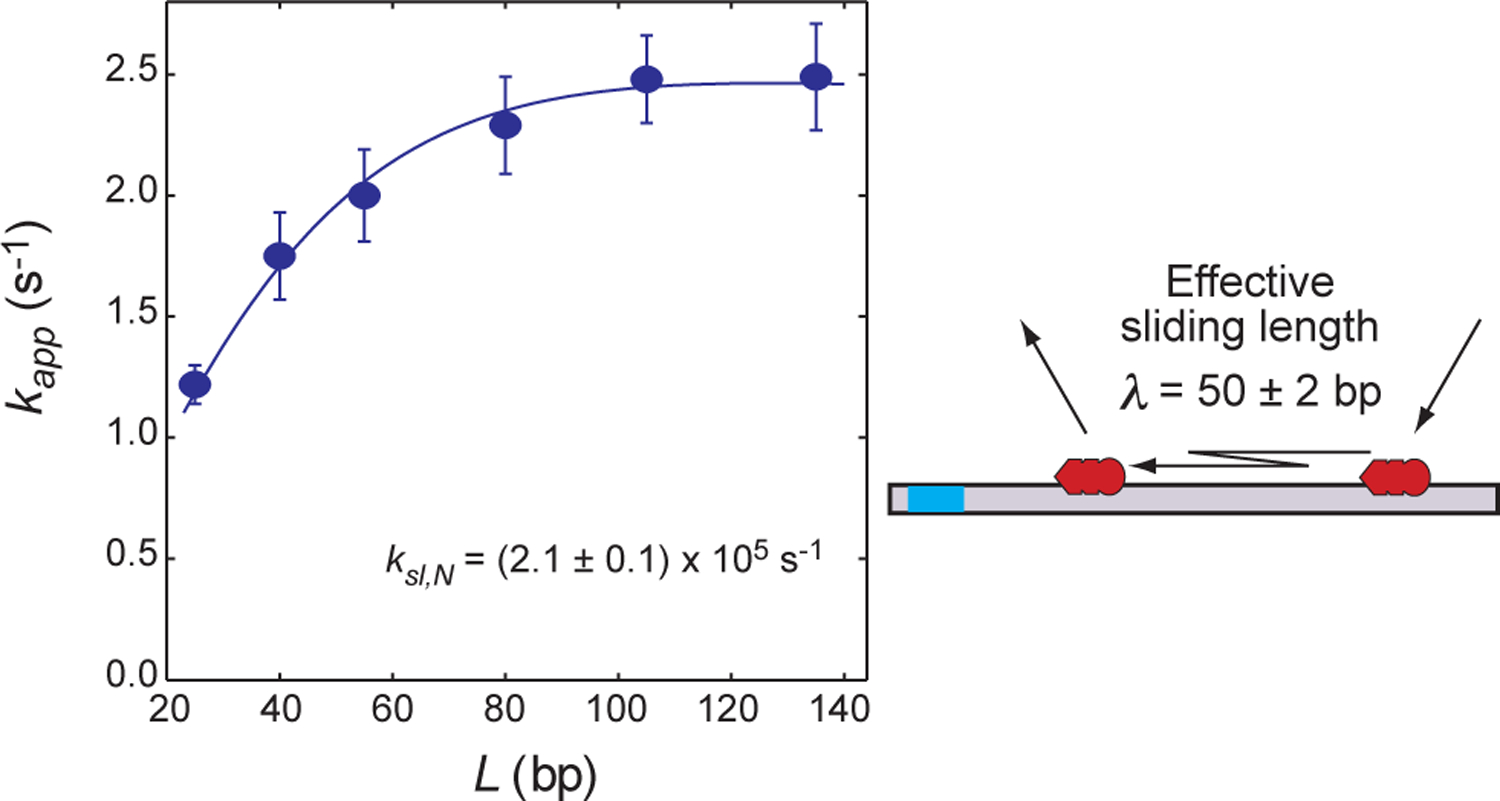
DNA-length dependence of the target association kinetics measured for the Egr-1 zinc-finger protein at 80 mM KCl (Dtot = 2.5 nM; Ptot = 50 nM; and Ctot = 2 μM). The pseudo-first-order rate constant kapp for target association is plotted as a function of the total number of sites on the probe DNA. The blue curve represents the best fit to Eq. 12. The effective sliding length λ is given by Eq. 21. Note that an increase in L beyond 2λ does not enhance the target association. The error bars represent the standard deviations for 8 – 10 replicates.