
Figure 8.
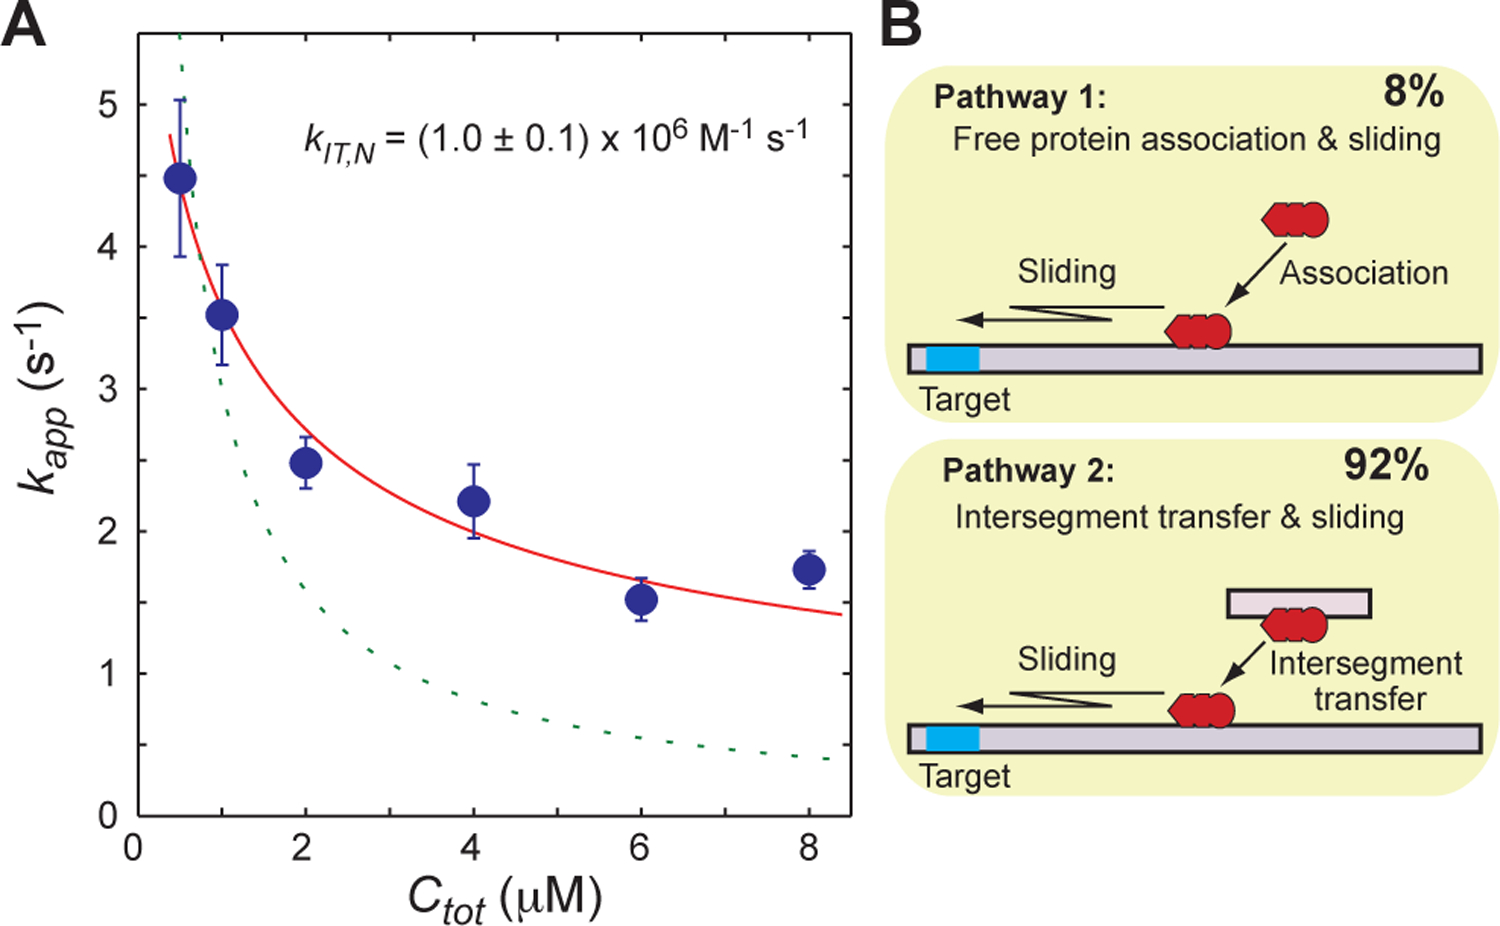
(A) Competitor DNA concentration (Ctot) dependence of the apparent rate constant kapp measured for Egr-1 (Ptot = 50 nM) at 80 mM KCl. The 113-bp probe DNA was used (Dtot = 2.5 nM). The circles represent the experimentally measured kapp constants. The error bars represent the standard deviations for 8 – 10 replicates. The solid red lines are the best-fit curve to Eq. 18, which accounts for intersegment transfer. The dotted green lines are the best-fit curve to Eq. 12, which does not account for intersegment transfer. (B) Contributions of major target association pathways under the current experimental conditions.