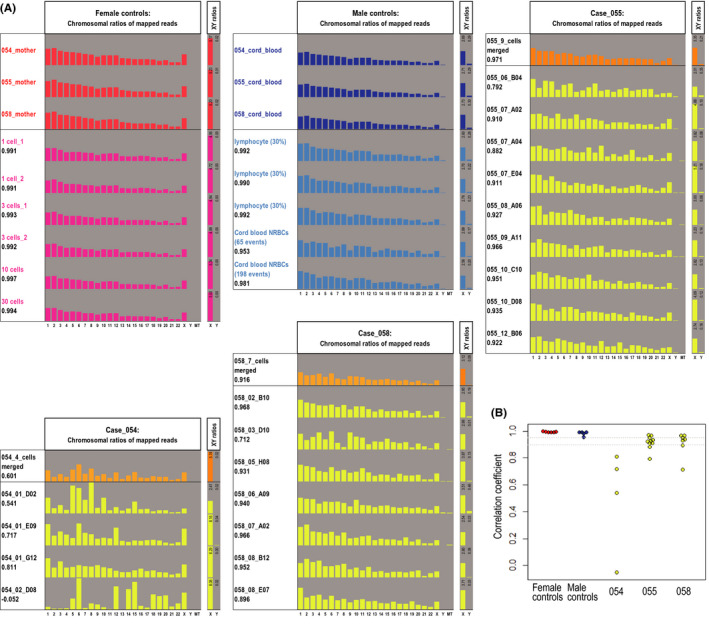
FIGURE 2.

A. Chromosomal distribution of mapped reads observed in regular WGS libraries and WGA‐based WGS libraries. The chromosomal ratios of female and male control libraries are shown in red/magenta bars and blue/light‐blue bars, respectively. The chromosomal ratios of merged and individual data of fNRBC candidates are shown in orange and yellow bars, respectively. The vertical‐axis ranges for all chromosomes (1 to 22, XY, and MT) and for sex chromosomes are 0% to 20% and 0% to 6%, respectively. B. The correlation coefficient between the chromosomal ratios of mapped reads of a WGA‐based WGS library and the averaged ratios of control regular WGS libraries is shown for each WGA‐based WGS library. Female control WGA–WGS libraries were compared with the averaged ratio of three female control regular WGS libraries (“mother”). Male control and fNRBC WGA–WGS libraries were compared with the averaged ratio of three male control regular WGS libraries (“cord_blood”). Two horizontal dashed lines represent correlation coefficient levels of 0.90 and 0.95
