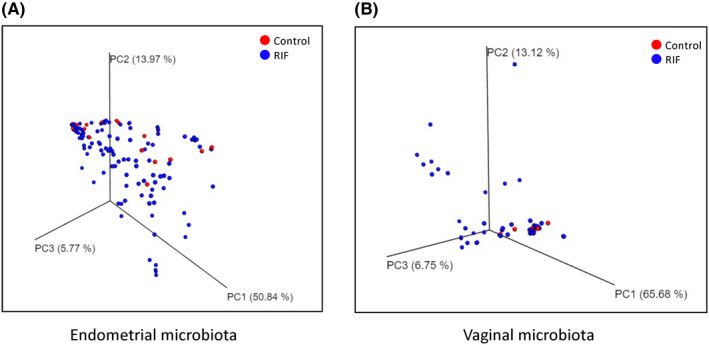
FIGURE 4.

PCoA plot showing the relationship between the bacterial compositions of the controls and patients with RIF. (A) Principal coordinate analysis (PCoA) plot based on weighted UniFrac distance representing the endometrial microbiotas of the controls (red) and patients with repeated implantation failure (RIF) (blue). PCoA plot showing the relationship between the bacterial compositions of the endometrial and vaginal microbiotas. One red dot represents one control individual; one blue dot represents one RIF patient. A PERMANOVA test was conducted to compare the β‐diversity between the controls and RIF patients (P = .30). (B) PCoA plot based on the weighted UniFrac distance representing the vaginal microbiota (P = .053)
