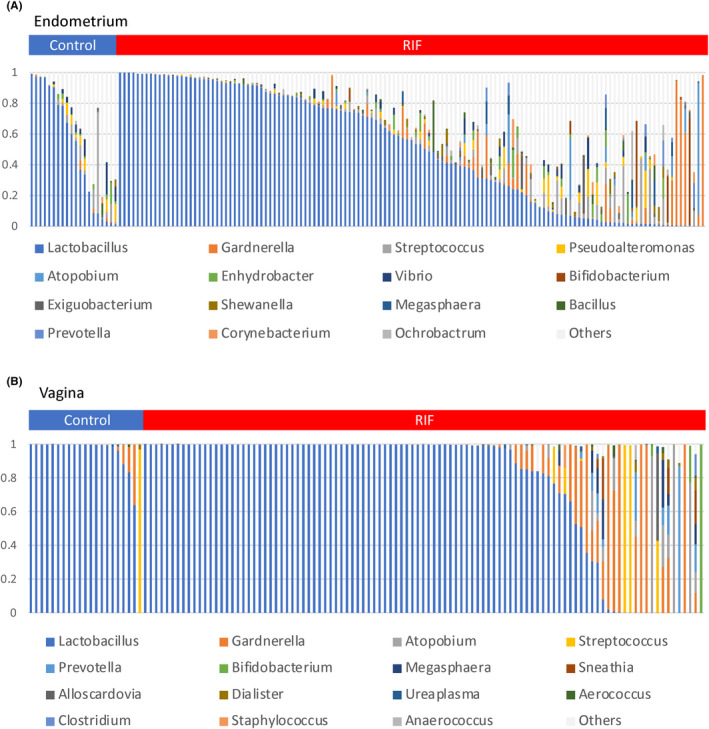
FIGURE 5.

Bar charts of the bacterial species compositions in the vaginal and endometrial microbiotas of 166 participants. Endometrial (A) and vaginal (B) microbiotas. Twenty‐five bacterial species were detected from the vagina, and 131 were detected from the uterus. The top 15 bacterial species are displayed. One bar on the horizontal axis represents one sample. The vertical axis represents the bacterial abundance in the microbiota
