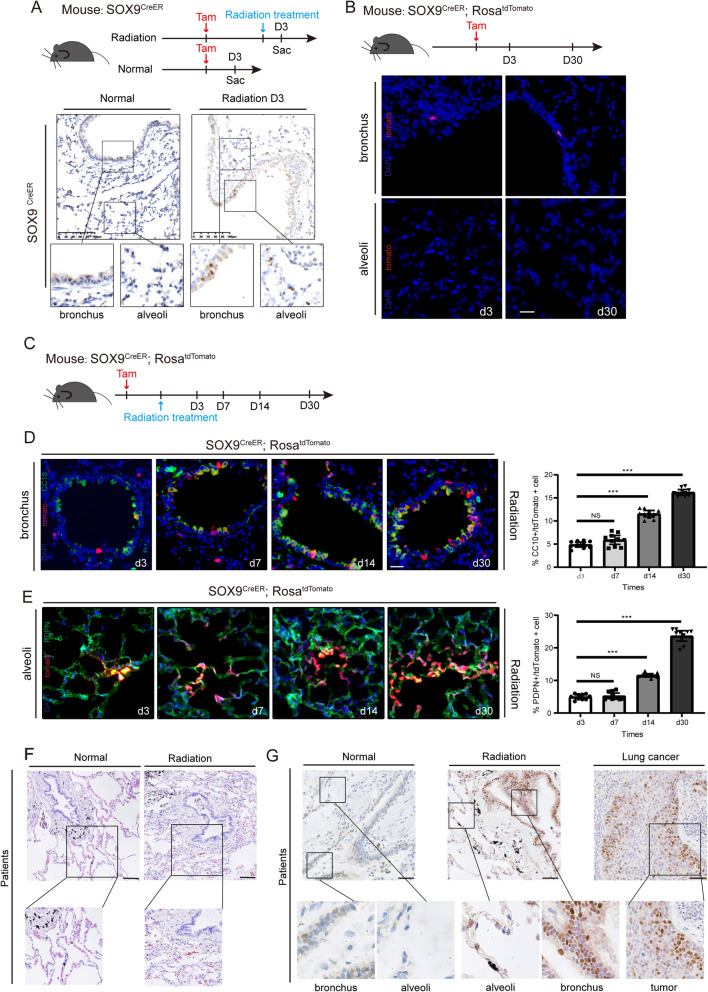
Fig. 1.
Sox9-expressing cells contribute to the regeneration of the lung after radiation. A Top: the experimental design for the control and radiation groups. Bottom: representative IHC staining images of Sox9 in the control group (left) and radiation damage group (right) of Sox9CreER mice. Lung tissues were collected 3 days after radiation treatment. n = 3. Scale bar, 100 μm. B Top: the experimental design for Sox9+ cell lineage tracing for the control and radiation groups. Bottom: representative images of lineage tracing in lung tissue sections under homeostatic conditions. Nuclei were stained with DAPI (blue). Lung tissues were collected 3 and 30 days after radiation treatment. n = 3. Scale bar, 50 μm. C The experimental design for Sox9+ cell lineage tracing of Sox9CreER; RosatdTomato mice after treatment with radiation. Before treatment, the mice were injected with tamoxifen (Tam). Mice were sacrificed 3, 7, 14 and 30 days after radiation treatment. n = 3. D Representative images of Sox9+ cell-driven lineage tracing in bronchi of Sox9CreER; RosatdTomato mice after radiation injury (left). Percentage of CC10+/tdTomato+ cells was assessed (right). *p < 0.05, **p < 0.01 and ***p < 0.001 as determined by unpaired Student’s t test. Nuclei were stained with DAPI (blue). Lung tissues were collected 3, 7, 14 and 30 days after radiation treatment. n = 3. Scale bar, 50 μm. E Representative images of Sox9+ cell lineage tracing in the alveoli of Sox9CreER; RosatdTomato mice after radiation injury. Percentage of PDPN+/tdTomato+ cells was assessed (right). *p < 0.05, **p < 0.01 and ***p < 0.001 as determined by unpaired Student’s t test. Nuclei were stained with DAPI (blue). Lung tissues were collected 3, 7, 14 and 30 days after radiation treatment. n = 3. Scale bar, 50 μm. F Representative images of H&E staining in the lung tissue of normal controls and radiation patients. Scale bar, 100 μm. G Representative IHC staining images of Sox9 in normal lung tissue (left), after lung tissue damaged by radiation (middle) and lung cancer tissue (right) in patients. Scale bar, 50 μm

