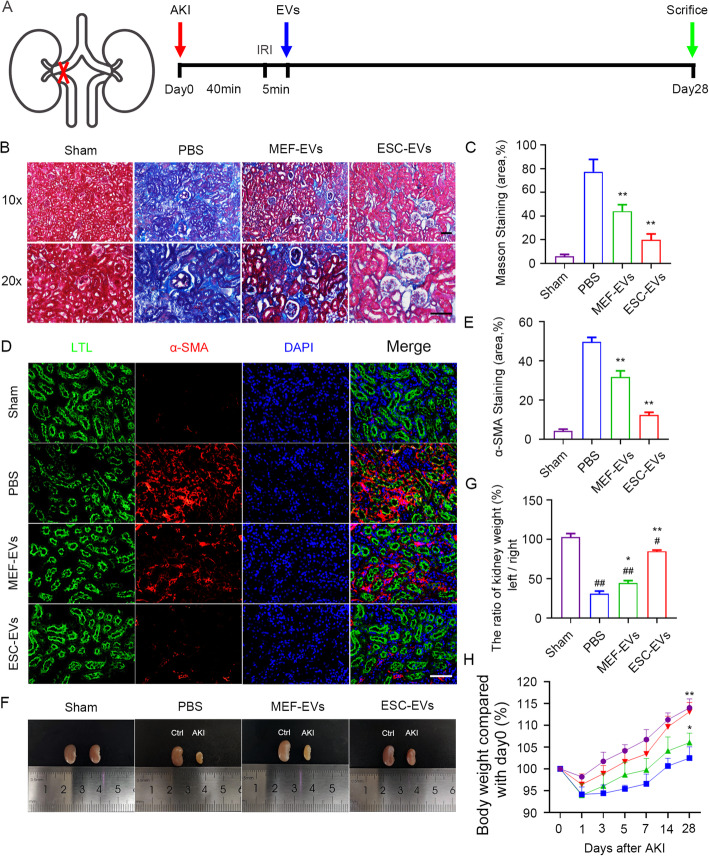
Fig. 3.
Treatment of ESC-EVs inhibit renal fibrosis. a Schematic illustration for AKI and EV treatment. The left renal pedicle was clamped with noninvasive microvascular forceps for 40 min without any operation on the contralateral. After 5 min eperfusion, 100 μg EVs were injected into the upper and lower poles of the left renal cortex. The kidney tissues were collected on day 28 after the injury. b Representative images of Masson staining for renal tissues harvested on day 28 post AKI. Scale bar represents 100 μm. c Quantification of the area of Masson staining. Quantitative analysis of 5 random fields in tissue sections of 5 different mice. d Representative images of α-SMA immunofluorescence staining at day 28 after AKI. Scale bar represents 100 μm. e Quantification of the area of α-SMA staining. Quantitative analysis of 5 random fields in tissue sections of 5 different mice. f Morphology of the left and right kidneys of mice after 28 days of AKI. The kidney on the left is the right kidney of the mouse (control side), and the right is the left kidney of the mouse (ischemia-reperfusion side). The two kidneys in each photo were isolated from same mouse. g The percentage of the weight of the left kidney (ischemia-reperfusion side) versus the weight of the right kidney (control side) at day 28 after AKI. The data are presented as mean ± SEM. h Changes in body weight of mice (vs. 0 days after AKI) over time. The data are presented as mean ± SEM. (n = 5; #P < 0.05 versus Sham, ##P < 0.01 versus Sham, *P < 0.05 versus PBS, **P < 0.01 versus PBS)

