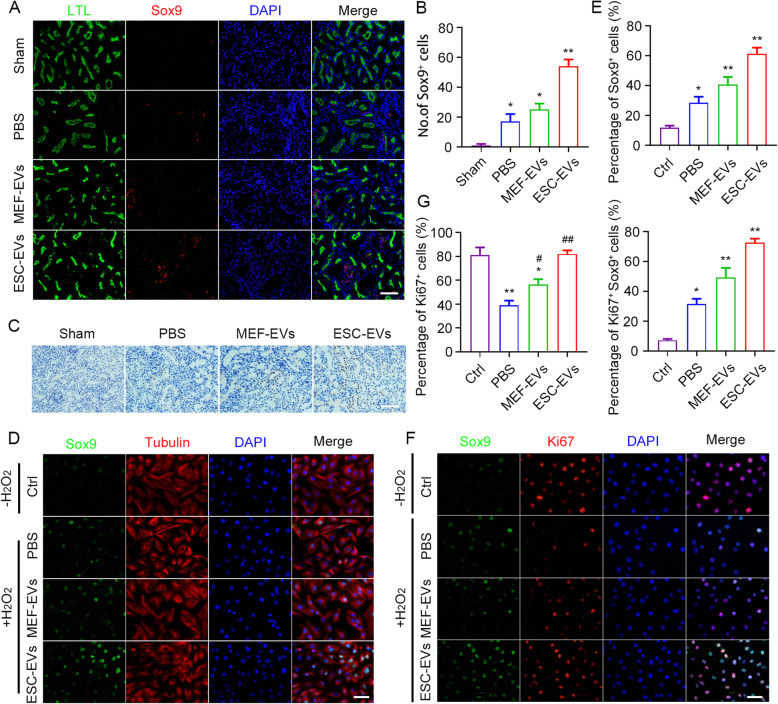
Fig. 7.
ESC-EV treatment activate Sox9 expression in the injured kidney. a Representative images of Sox9 immunofluorescence staining at day 3 after AKI. Scale bar represents 100 μm. b Quantification of Sox9-positive cells in each group. c Representative images of Sox9 immunohistochemical staining at day 3 after AKI. Scale bar represents 100 μm. Quantitative analysis of 5 random fields in tissue sections of 5 different mice. d Representative immunofluorescence images of Sox9 expression in HK-2 cells with and without H2O2 pretreatment. Scale bar represents 100 μm. e Quantification of the percentage of Sox9-positive HK-2 cells. f Representative immunofluorescence images of Sox9 and Ki67 expression in HK-2 cells with and without H2O2 pretreatment. Scale bar represents 100 μm. g Quantification of the percentage of Ki67-positive HK-2 cells and Ki67/Sox9 double-positive HK-2 cells. The data are presented as mean ± SEM. (n = 5; *P < 0.05 versus Ctrl, **P < 0.01 versus Ctrl, #P < 0.05 versus PBS, ##P < 0.01 versus PBS)

