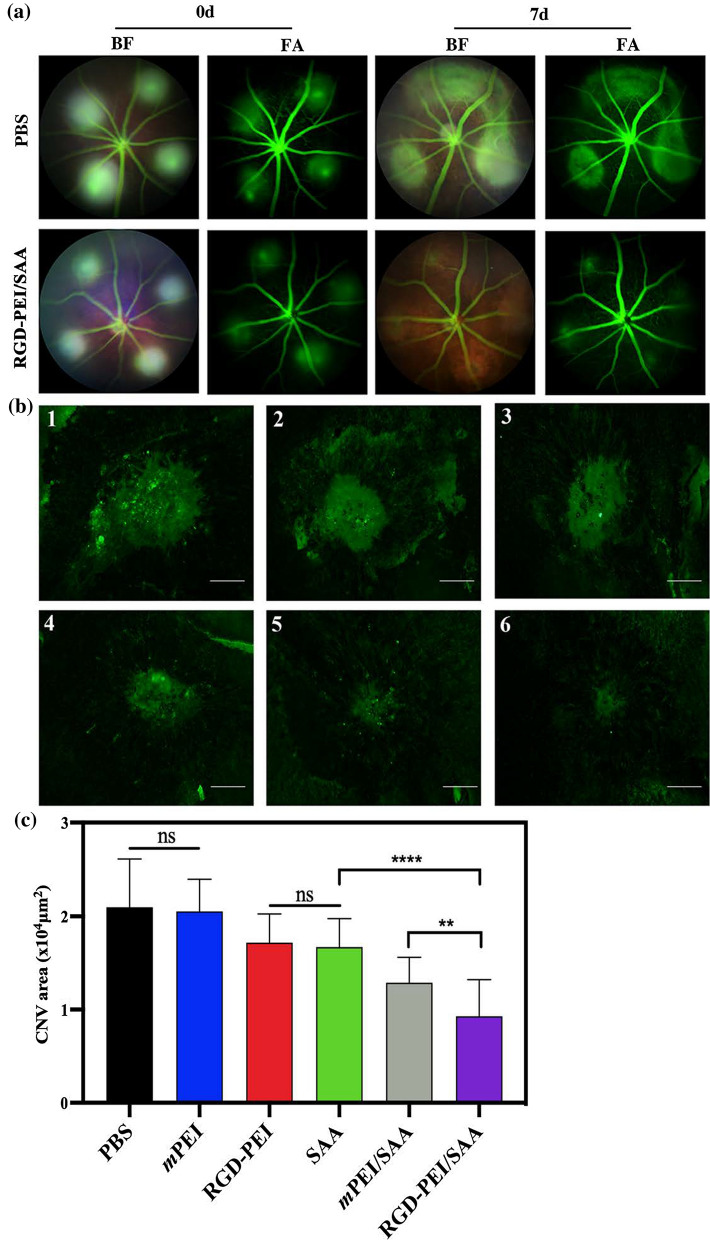
Fig. 6.
RGD-PEI/SAA reduced neovascularization in laser-induced CNV mice model. a Representative eye fundus photographs of BF (bright field) and FA (fluorescein angiography) obtained on Day 0 and Day 7 after laser injury with intravitreal injection of PBS or RGD-PEI/SAA (2.5 µM, 2 µL/eye). b Representative images of isolectin B4 staining laser-induced CNV RPE/choroid/sclera flat mounts after intravitreal injection of PBS (1), mPEI (2), RGD-PEI (3), SAA (4), mPEI/SAA (5) and RGD-PEI/SAA (6) at an SAA concentration of 20 µM, 2 µL/eye. Scale bar = 100 µm. c Quantitative analysis of the average CNV area (mm2) in each group (n = 28). Error bar stands for the standard error of the mean (** for p < 0.01, **** for p < 0.0001)

