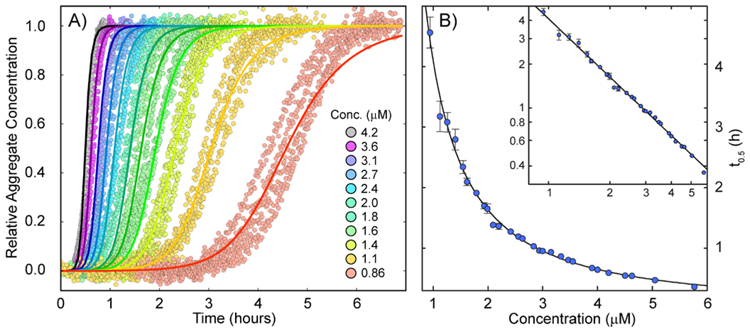
Figure 2.
Kinetics monitored by thioflavin T at 37°C. A. Examples of aggregation data at 11 peptide concentrations in quadruplicate together with a global fit k+kn =900 M−2s−2; k+k2 = 1·1011 M−3s−2). B. Half time of aggregation versus peptide concentration combined from three experiments of the type shown in panel A, plus a fitted power function with exponent −1.3.

