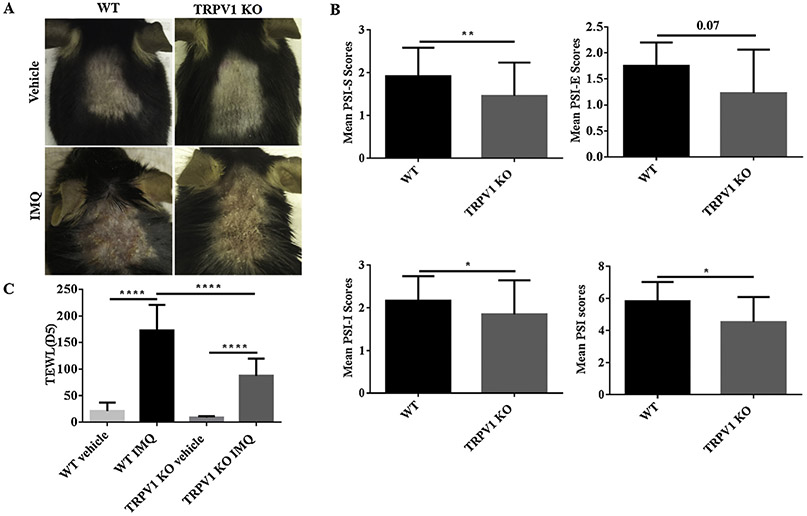
Fig. 1.
PSI and TEWL scores of IMQ-induced PsD. (A) Representative images are shown of the back skin of vehicle- and IMQ-treated in WT mice vs. TRPV1 KO mice on Day 5. (B) The PSI scores, including scales (S), erythema (E), induration (I) are shown in mice treated with IMQ for 5 days in WT and TRPV1 KO group, respectively. (C) TEWL Scores in WT or TRPV1 KO mice with IMQ treatment are shown after 5 days (n = 12 in each vehicle group, n = 13 in each IMQ group). P-value scores for PSI scores were calculated by student t-test; TEWL scores by one-way ANOVA followed by post-hoc comparison (Tukey’s HSD) test. Mean ± S.D. values are indicated (*P < 0.05, **P < 0.01, ****P < 0.0001).

