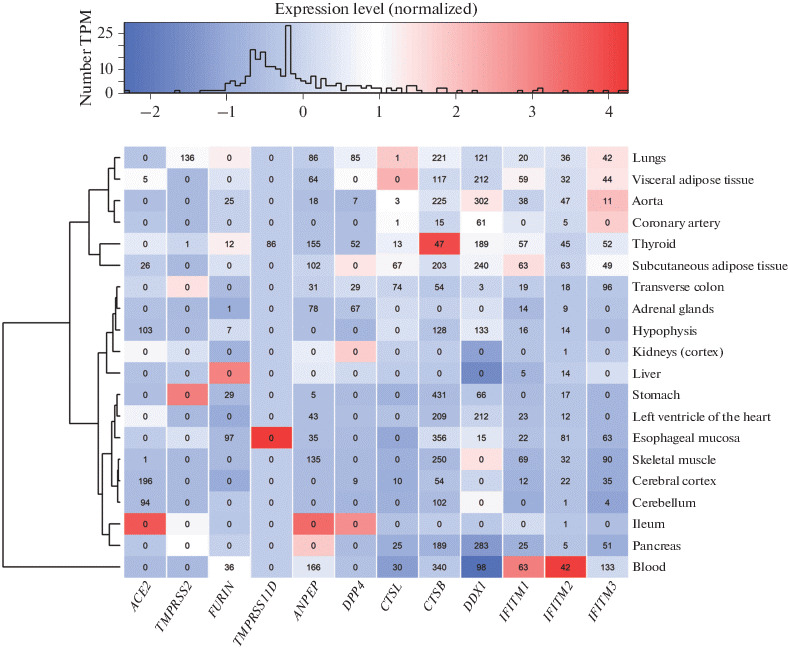
Fig. 1.

The heat map reflecting the expression level of the candidate genes for the susceptibility to SARS-CoV-2 in various human organs/tissues (constructed from median values of the number of transcripts per million (TPM) according to [45]). The expression level is normalized according to the genes for which zero corresponds to the average level of gene expression. The values in the wells reflect the number of statistically significant eQTLs affecting the level of gene expression in the respective tissues.
