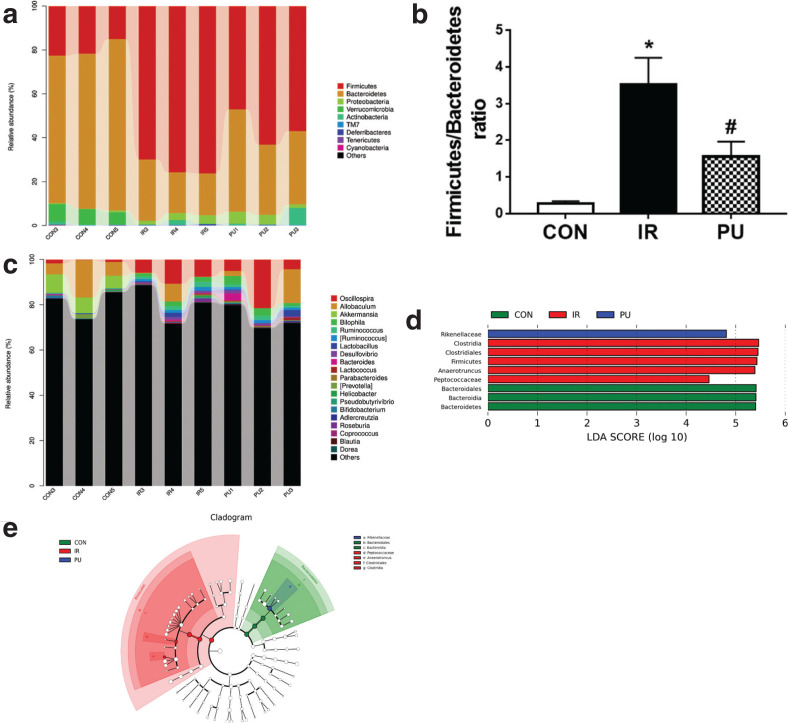
Fig. 5.
Effect of PU on gut microbiota. Relative abundance distribution at bacterial phylum levels (a). Comparison of firmicutes/bacteroidetes ratio in different groups (b). Top 20 enriched genera categories (c). LDA at the level of phylum, class, order and genera (d). Cladogram generated by LEfSe analysis (e). Values indicate mean ± SD. (n = 3) *P < 0.05, compared with the CON group, #P < 0.05, compared with the IR group.

