Figure 2.
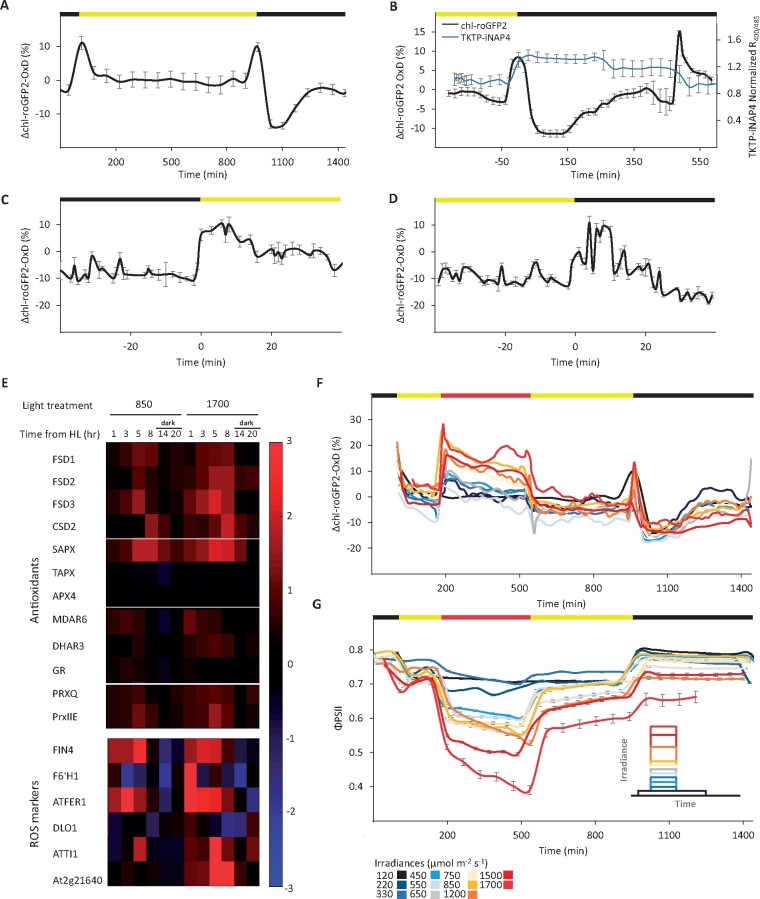
Diurnal changes in the degree of chl-roGFP2 oxidation under normal and HL growth conditions. chl-roGFP2 fluorescence was monitored over a 24-h period and chl-roGFP2 OxD values were calculated. Oxidation values were normalized to steady-state values (as observed during the day at a constant light intensity of 120 µmol m−2 s−1). Horizontal bars above graphs show light (yellow) and dark (black) periods. A, Changes in chl-roGFP2 OxD over time from the light onset under normal growth light conditions. Values are presented as means of eight plants ± SE. B, Changes in chl-roGFP2 OxD and normalized R400/485 of TKTP-iNAP4 over time during the nighttime. Results of TKTP-iNAP4 were normalized using the pH control sensor (TKTP-iNAPc) according to Lim et al. (2020) and values are presented as means of 12 plants ± SE. C, Oxidation and rereduction of chl-roGFP2 during dark-to-light transitions. Values are shown as means of 16–24 plants ± SE. D, Oxidation and rereduction of chl-roGFP2 during light-to-dark transitions, shown as means of 16–45 plants ± SE. E, Temporal changes in expression of chloroplast-targeted genes encoding antioxidant proteins and established ROS markers. Gene expression levels in plants exposed to HL (850 or 1700 µmol m−2 s−1) were normalized to the gene expression in plants grown under normal light conditions (120 µmol m−2 s−1) at each indicated time point after start of the HL illumination. All data are displayed as the log2 ratio. The red and blue colors represent high or low expression levels, respectively. F, Diurnal changes in chl-roGFP2 OxD in WT plants exposed to HL. For each treatment, between 21 and 24 plants, divided into three independent plates, were tested. For clear presentation of the redox changes of roGFP2 over time, a “sliding window” approach for the data along the x-axis was taken, in which each data point represents the average of three plates (n = 3). roGFP2 data were acquired using the chl-TKTP-roGFP2 line. For a depiction of absolute roGFP2 OxD values and illustration of SE values see Supplemental Figures S15, S16. G, Diurnal changes in chl-roGFP2 ΦPSII values in plants exposed to the same conditions as in (F). ΦPSII values were derived from chlorophyll fluorescence analysis and represent means of 12 plants ± SE. Inset: Experimental design for the HL experiments.

