Figure 5.
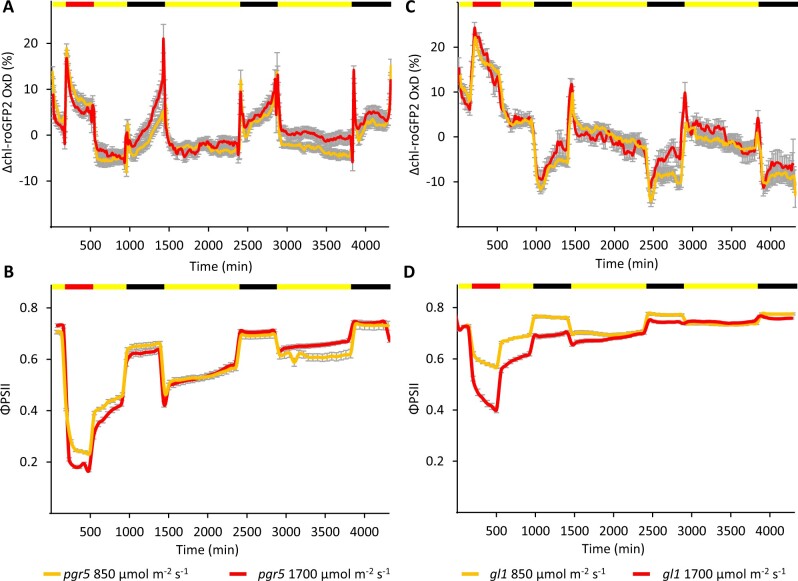
Diurnal changes in chl-roGFP2 OxD and ΦPSII during 1 day of HL regime followed by 2 days of normal light conditions in pgr5 and gl1 plants. A and C, Changes in chl-roGFP2 OxD over time from the experiment onset. chl-roGFP2 fluorescence was monitored throughout the experiment and chl-roGFP2 OxD values were calculated. Oxidation values were normalized to steady-state oxidation levels. Each treatment involved 32 plants divided into 4 independent plates that were consolidated in a “sliding window” (n = 4) display. Values represent means ± SE for pgr5 (A) and gl1 (C). roGFP2 data were acquired using the chl-PRXaTP-roGFP2. B, ΦPSII over time from the experiment onset. ΦPSII values were derived from chlorophyll fluorescence measurements and represent means of 12 plants ± SE for pgr5 (B) and gl1 (D). The color bar denotes the light conditions: black, night; yellow, normal light; and red, HL.

