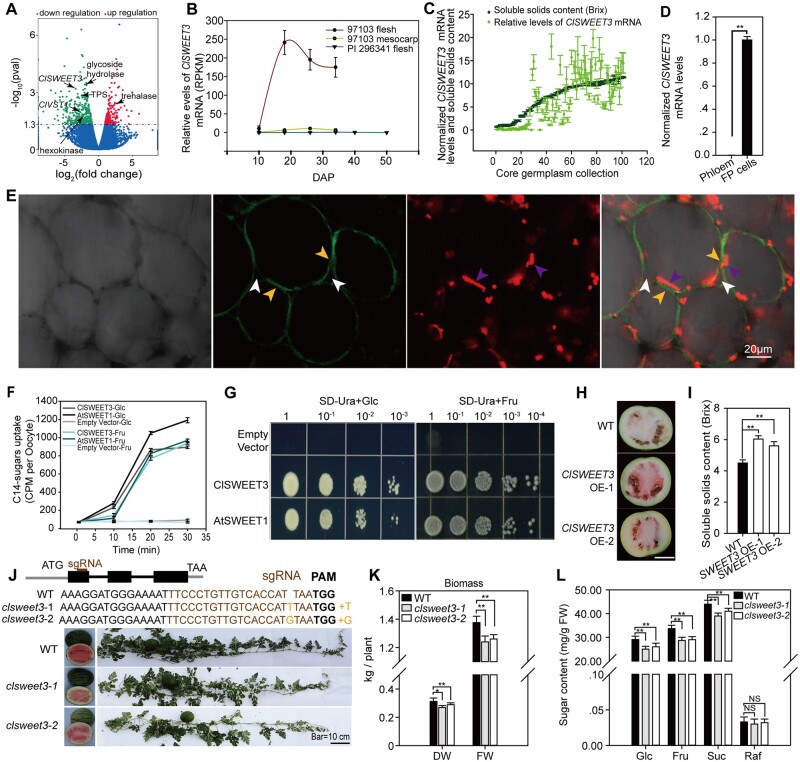
Figure 5.
ClSWEET3 accelerates sugar accumulation. A, Transcriptome profiling showing upregulated and downregulated genes in claga2 knockout fruit compared to WT. Different expressed genes in Suc metabolism pathway, Suc transporter ClVST1 and hexose transporter ClSWEET3 are indicated by black arrows. B, Expression profiles of ClSWEET3 in fruit and mesocarp of sweet watermelon 97103 and fruit of non-sweet PI 296341. DAP, days after pollination. Error bars, sd for n = 3 independent biological replicates of RNA-seq data. C, ClSWEET3 mRNA levels and soluble solids content levels in 100 core germplasms. Error bars, sd for n = 3 fruit samples. D, ClSWEET3 mRNA levels in FP and phloem cells. Means ± sd of n = 3 LCM collected tissue samples from fruit are shown. P-values were calculated by two-tailed, unpaired t-tests. E, Plasma membrane localization of ClSWEET3-EYFP in watermelon fruit cells. Bright light, EYFP, RFP emission, and merged channels in ClSWEET3-EYFP transgenic overexpressing fruit cells after plasmolysis. The white arrows point to the cell wall, the purple arrows point to the red fluorescence of the chromoplastid, indicating the position of the cytosol, and the yellow fluorescent arrows point to the ClSWEET3-EYFP position on the plasma membrane separated from the cell wall. F, Time-point hexose uptake assay in Xenopus oocyte cells with [14C]-labeled Glc and Fru. Means of C14 intensity ± sd for n = 5 independent oocyte cells are shown. G, Complementation assay of yeast EBY4000 lacking 18 hexose transporter genes with ClSWEET3, AtSWEET1, and an empty vector. H, Two representative watermelon fruit of ClSWEET3 overexpressors. Bar = 10 cm. I, Soluble solids content in fruit of ClSWEET3 overexpressors and WT. Means ± sd for n = 3 fruits are shown. **t-test significant at P < 0.01. J, CRISPR/Cas9-generated clsweet3 alleles. The schematic diagram illustrates sgRNA targeting the first exon of ClSWEET3, which results in a null mutation of ClSWEET3. K, Biomass measured on the basis of FW and DW in the two lines of clsweet3 mutants. Error bars, sd for n = 3 independent plants. *t-test significant at P < 0.05, **t-test significant at P < 0.01. L, Fruit Suc, hexose and Raf contents in clsweet3 mutants. Average values ± sd for n = 3 independent biological replicates are shown. **t-test significant at P < 0.01.

