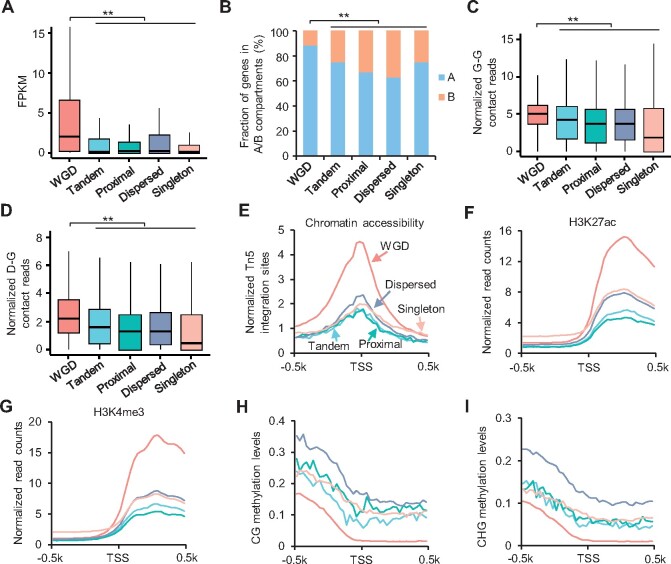
Figure 3.
More chromatin interactions in WGD genes than small-scale duplicate and single-copy genes. A, Expression levels of WGD, tandem, proximal, dispersed, and singleton genes. **Indicates P < 8e−100 (Wilcoxon rank-sum test). B, Percentage of WGD, small-scale duplicate, and single-copy genes in A/B compartments. **Indicates P < 2e−45 (Fisher’s exact test). C and D, Normalized G–G (C) and D-G (D) contacts of WGD, small-scale duplicate and single-copy genes. Y-axis indicates normalized contacts normalized by ICE method and gene length. **Indicates P < 2.5e−27 (Wilcoxon rank-sum test). E–I, Distributions of chromatin accessibility (E), H3K27ac (F), H3K4me3 (G), and DNA methylation (H, I) around TSSs of WGD, small-scale duplicate and single-copy genes. Different types of genes were indicated by different colors of lines.

