Figure 7.
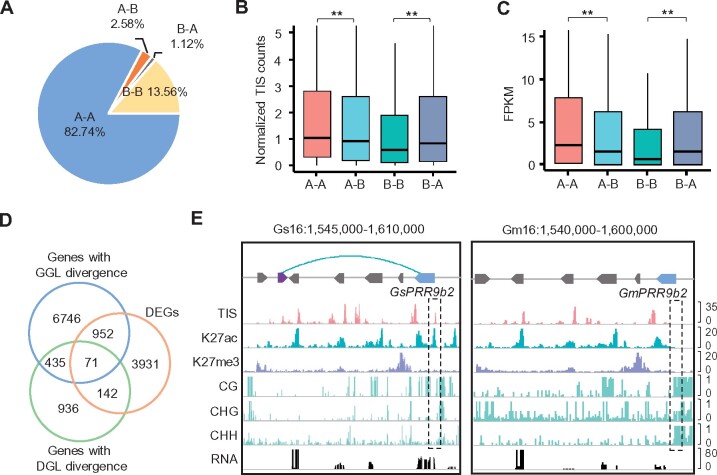
3D genome changes during domestication of soybean. A, A/B compartment conversions of orthologous genes between G. soja (Gs) and G. max (Gm). A–B or B–A indicates the compartment conversions from A to B or B to A for Gm compared with Gs. A–A or B–B indicate same compartment types between Gs and Gm. B and C, Chromatin accessibility (B) and expression levels (C) of genes in A–A, A–B, B–A, and B–B compartments in G. soja. **Indicates P < 7e−4 (Wilcoxon rank-sum test). D, Venn diagram showing the overlap among genes with GGL divergence, genes with DGL divergence and DEGs between Gs and Gm. DEGs were identified by P < 0.01 (ANOVA test) and log2(Fold change) ≥1. E, Chromatin contacts, epigenetic states, and expression levels of PRR9b2 in G. soja and G. max. Blue and gray arrowed blocks indicate orthologous genes. A purple arrowed block indicates a gene present in G. soja but absent in G. max.

