Figure 5.
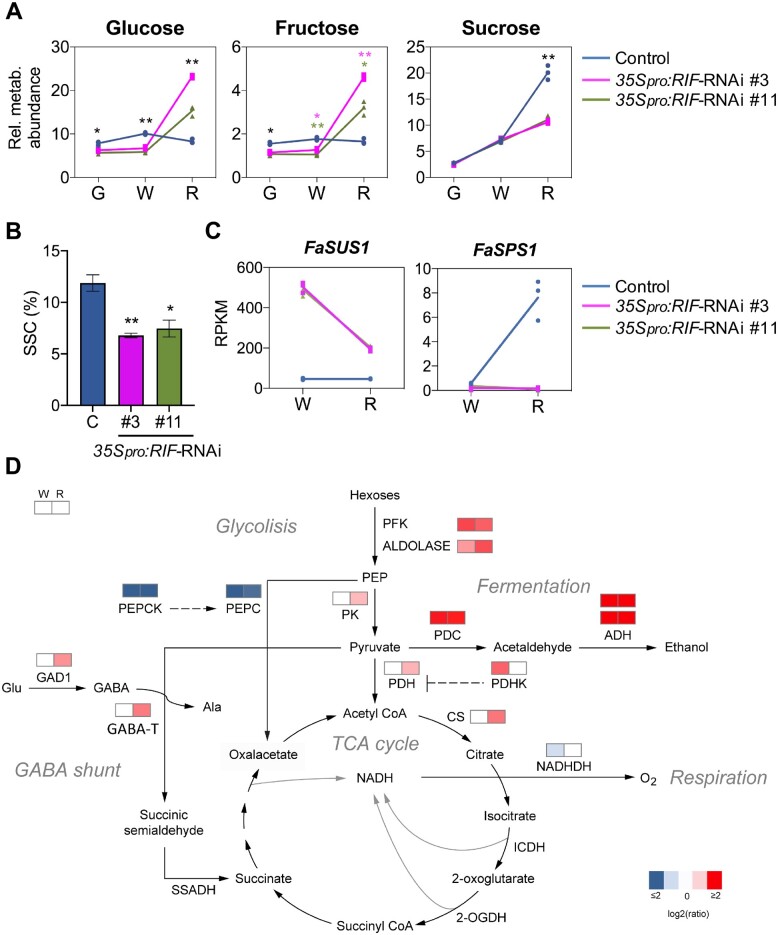
FaRIF contributes to the regulation of primary and energy metabolism. A, Content of main sugars in control and 35Spro:RIF-RNAi receptacles at three ripening stages. Data are normalized to the mean response calculated for an internal control. B, Quantification of SSC. C, Expression of genes involved in sucrose metabolism supporting higher levels of glucose and fructose and lower levels of sucrose. D, Expression of genes involved in glycolysis, TCA cycle, fermentation, respiration, and GABA shunt by RNA-seq. Colors denote the average log2 fold-change of 35Spro:RIF-RNAi/control in both transgenic lines, at the white and red stages. Red and blue show up- and downregulation, respectively, in both silenced lines. Data in (A) and (B) are from three and 10 biological replicates, respectively, analyzed by Student’s t test (*P < 0.01; **P < 0.001). Colored asterisks denote significant difference for one of the RNAi lines compared with the control. G, green; W, white; R, red receptacles.

