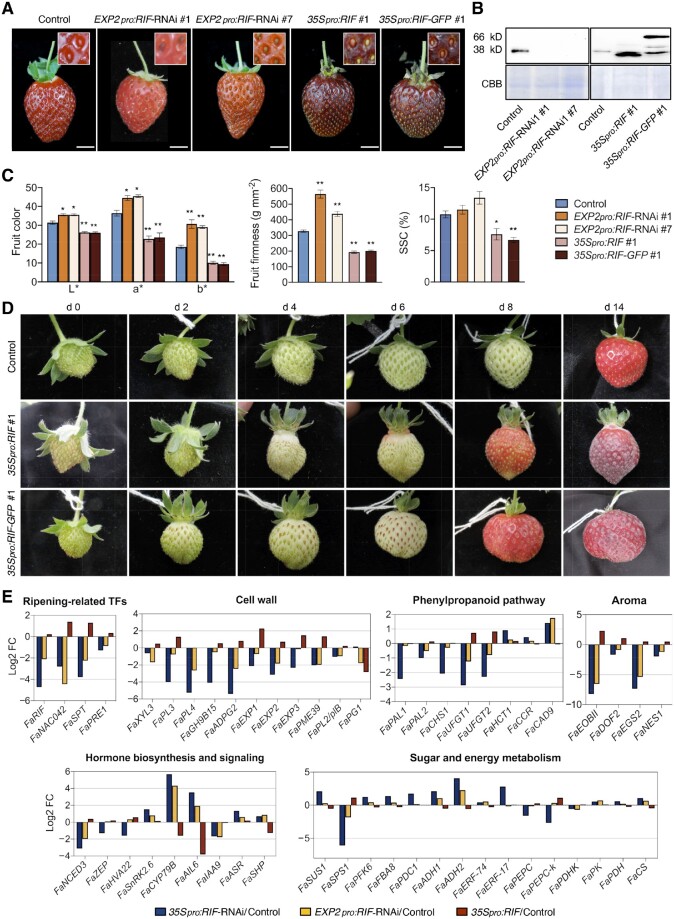
Figure 6.
Effects on ripening when FaRIF is specifically silenced at late stages of receptacle ripening (EXP2 promoter) or overexpressed (35S promoter). A, Fruit phenotype at the red stage in control and stable EXP2pro:RIF-RNAi, 35Spro:RIF and 35Spro:RIF-GFP transgenic lines. Inset: detail of the achenes. Scale bars, 1 cm. B, Immunoblot analysis in control and stable EXP2pro:RIF-RNAi, 35Spro:RIF and 35Spro:RIF-GFP ripe receptacles to detect native FaRIF protein (38 kD) and FaRIF–GFP fusion protein (66 kD) using anti-FaRIF antibody (upper). CBB staining of total nuclear protein extracts are shown in the (bottom) as loading control. C, Color characterization in the CIELAB color space for the lightness coefficient (L*), green-red (a*), and yellow-blue spectrum (b*) (left plot); fruit firmness measurements (middle plot); quantification of SSC (right plot). Data are means ± se of 10 biological replicates analyzed by Student’s t test (*P < 0.05; **P < 0.001). D, Representative pictures of a single fruit for control and FaRIF overexpression lines out of 10 analyzed showing the color progression over 14 days. Fruit size cannot be directly compared across panels. E, Log2 fold-change of genes involved in different processes in 35Spro:RIF-RNAi, EXP2pro:RIF-RNAi, and 35Spro:RIF.

