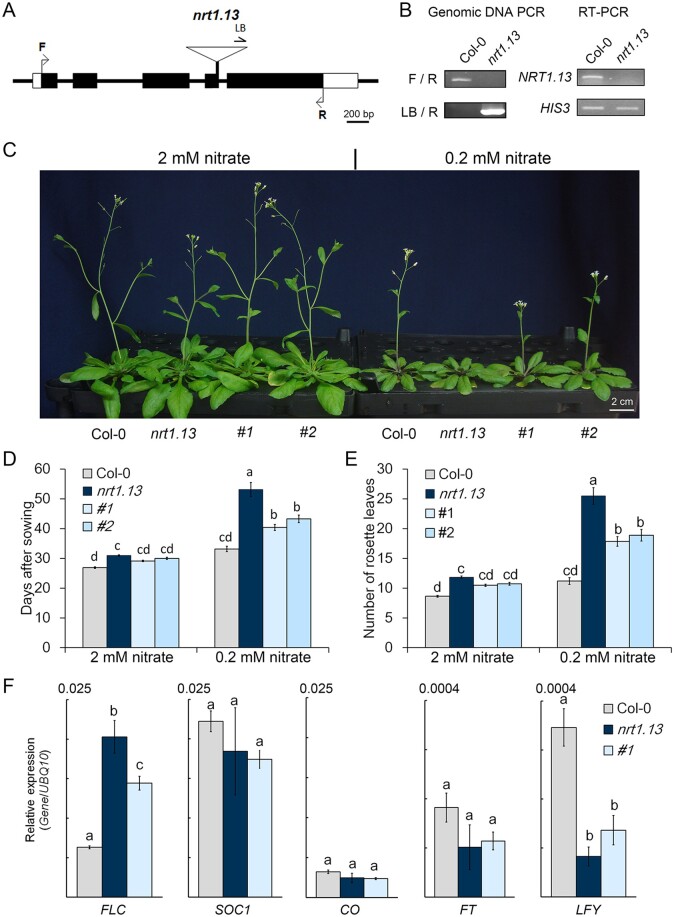
Figure 4.
The late-flowering phenotype of nrt1.13 is more severe under low-nitrate conditions. (A) Schematic of the T-DNA insertion site of the nrt1.13 mutant. In nrt1.13, the T-DNA was inserted into the fourth exon. Black boxes, coding region; white boxes, untranslated region; F and R, the forward and reverse primer, respectively, used for genomic DNA PCR and RT-PCR; LB, left border primer of T-DNA. (B) Genomic DNA PCR and RT-PCR analyses of nrt1.13. Total RNA was obtained from petioles of indicated plants. HIS3, the internal control of RT-PCR. (C) Photo of 43-day-old plants grown hydroponically with 2 or 0.2 mM nitrate. PNRT1.13:NRT1.13-GFP/nrt1.13 #1 and #2 are two independent complementation lines. (D) and (E) Flowering time of plants grown under normal (2 mM) and low (0.2 mM) nitrate, indicated as days after sowing (D) or measured as the number of rosette leaves at bolting (E). Values are means ± SE of 25 independent plants. Statistical analysis comprised one-way ANOVA with a Tukey post hoc test (P<0.05; Supplemental Data set 1). Similar results were obtained in four independent experiments. (F) Expressions of FLC, CO, FT, SOC1, and LFY measured by RT-qPCR. Total RNA was isolated from whole leaves of 25-day-old plants supplied with 0.2 mM nitrate. Values are the means ± SE of three independent samples. Statistical analysis comprised one-way ANOVA with a Tukey HSD post hoc test (P < 0.05). Similar results were obtained from two additional experiments.

