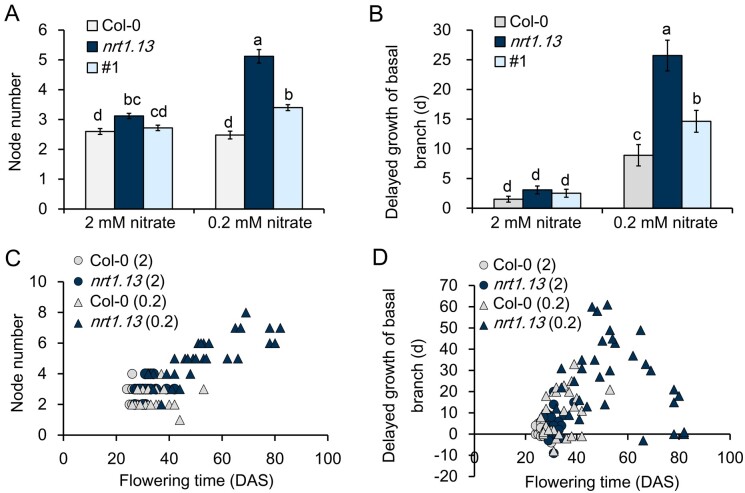
Figure 7.
Branching pattern is altered in nrt1.13. (A) Node number of the primary inflorescence stem for plants grown under low (0.2 mM) and normal (2 mM) nitrate. Values are means ± SE of 25 independent plants. (B) Growth difference between basal and apical branches for plants grown at low and normal nitrate. The day when the apical and basal branch lengths reached 0.5 cm was recorded and compared. Data presented represent the delayed growth of basal branches compared to apical branches. Values are means ± SE of 25 independent plants. Statistical analysis in A and B comprised one-way ANOVA with a Tukey B post hoc test (P<0.05; Supplemental Data set 1). (C) and (D) Relationship between the phenotypes of flowering time and node number (C) or flowering time and delayed growth of basal branches (D) for plants grown under low or normal nitrate. Circles, normal nitrate (2 mM); triangles, low nitrate (0.2 mM); white, Col-0 plants; black, nrt1.13 plants. Data from 28, 28, 30, and 32 plants of Col-0 (2 mM), Col-0 (0.2 mM), nrt1.13 (2 mM), and nrt1.13 (0.2 mM), respectively, are presented. The Pearson correlation coefficients (r) are 0.788 (n=124, P=0.000) between the flowering time and branch number and 0.467 (n=119, P=0.000) between the flowering time and outgrowth of basal branches (Supplemental Data set 1). Similar results were observed in another two experiments.

