Figure 2.

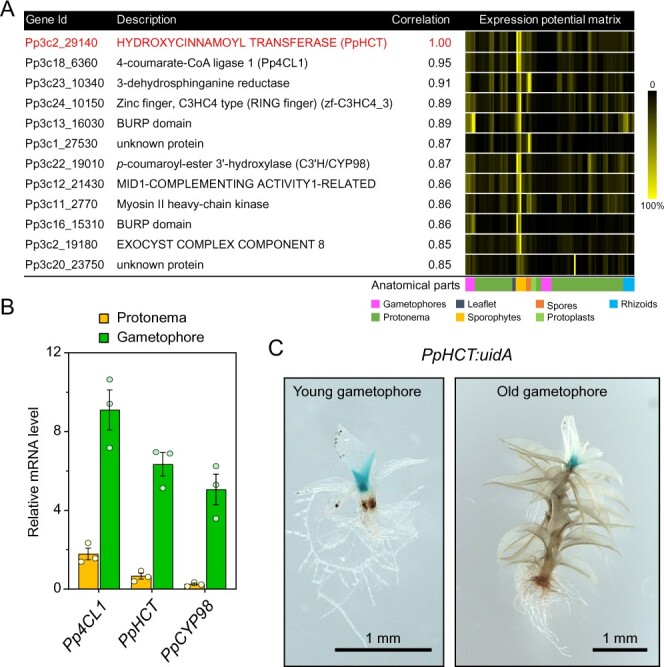
PpHCT co-expression network and expression pattern. A, List of genes co-expressed with PpHCT (Pp3c2_29140). Each element of the matrix represents the expression potential (% of maximum expression across the matrix) of a given gene (line) in a defined condition (column) derived from various anatomical parts. Data are retrieved from the P. patens gene atlas project (Perroud et al., 2018). B, RT-qPCR monitoring of Pp4CL1, PpHCT, and PpCYP98 expression in protonema and gametophore tissues. Data are the mean ± SEM of three biological replicates derived from three independent cultures. C, GUS staining pattern in PpHCT:uidA lines indicating prominent expression in the apex of gametophores.
