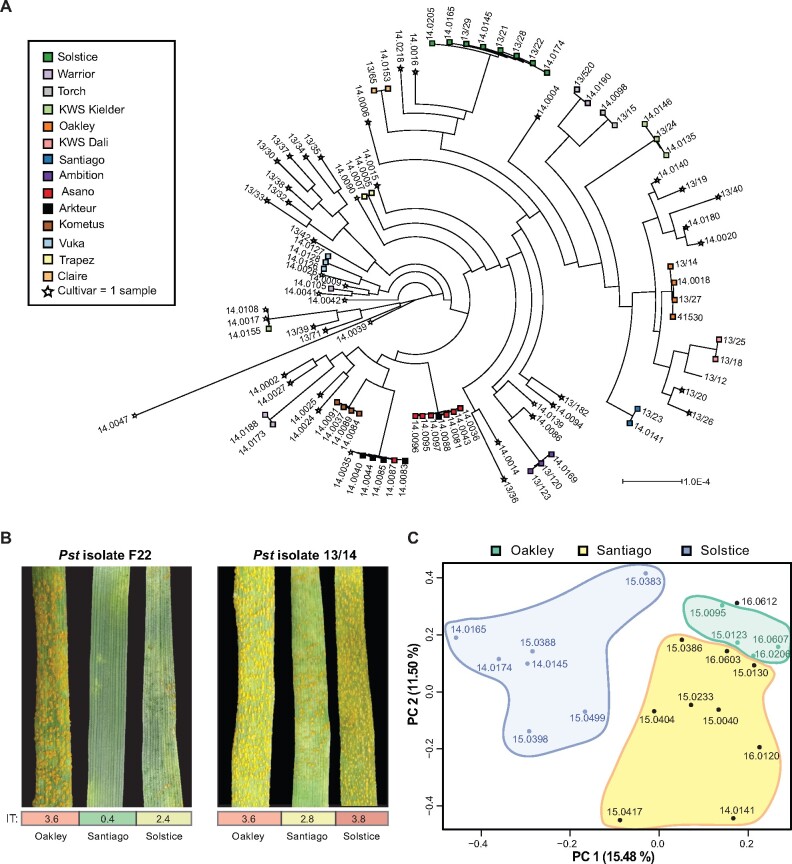
Figure 1.
RNA-seq analysis can be used to define the wheat variety in Pst-infected wheat samples. A, Pst-infected wheat samples cluster genetically based on variety. Phylogenetic analysis was carried out using 96 Pst-infected wheat samples with a maximum-likelihood model (227,267,910 nucleotide sites). Scale bar represents nucleotide substitutions per site; colors reflect wheat variety; stars indicate samples from a wheat cultivar with a single sample. Bootstrap values are provided in Supplemental Data File 2. B, The three wheat varieties Oakley, Solstice and Santiago have differing levels of susceptibility to the dominant Pst pathotypes (races) in Europe. Each of the three varieties was subjected to Pst infection with two isolates (F22 and 13/14) and infection types (IT) recorded 12 dpi following the 0–4 scale (McIntosh et al., 1995). Values represent an average from five independent plants (Supplemental Table 1). C, Principal component (PC) analysis of wheat gene expression profiles illustrates that samples group together by wheat variety, with two well-defined groups: (1) Solstice and (2) Oakley and Santiago (blue, green, and black font, respectively)

