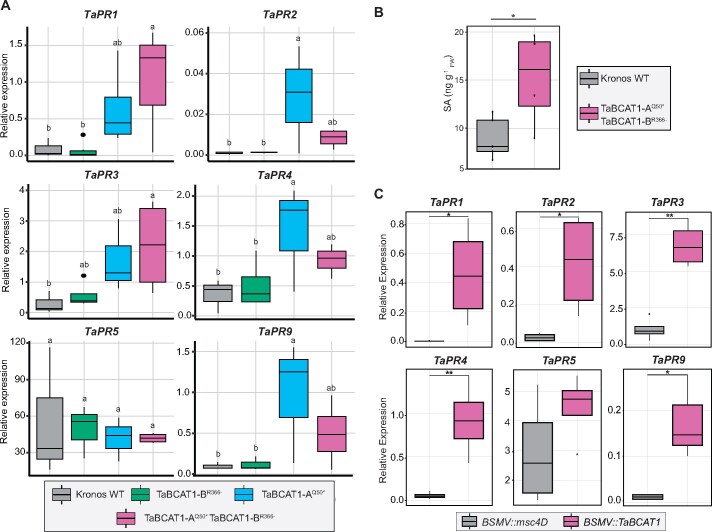
Figure 6.
PR gene expression and free SA levels are enhanced following disruption of TaBCAT1 in the absence of infection A. The relative expression of five of the six PR genes tested was significantly upregulated in TaBCAT1-AQ50*, TaBCAT1-BR366-, and/or TaBCAT1-AQ50* TaBCAT1-BR366- disruption mutants in the absence of rust infection. Letters indicate significant differences determined using Duncan’s multi range test (p < 0.05). Kronos WT n = 3, TaBCAT1-AQ50*n = 3, TaBCAT1-BR366-n = 3-4, TaBCAT1-AQ50* TaBCAT1-BR366-n = 4. B, This was accompanied by a two-fold increase in free SA levels in the TaBCAT1-AQ50* TaBCAT1-BR366- disruption mutant line in the absence of rust infection. Kronos WT n = 5, TaBCAT1-AQ50* TaBCAT1-BR366-n = 4. C, The levels of TaPR1, TaPR2, TaPR3, TaPR4, and TaPR9 expression were also significantly higher in TaBCAT1-silenced plants. Expression levels were assessed 9 dpvi using RT-qPCR in plants silenced with BSMV::TaBCAT1 (n = 4) and compared to the negative control, where BSMV::msc4D (n = 4) was utilized as a viral infection control. Asterisks denote statistically significant differences between each pair of conditions (**p < 0.01, *p < 0.05; two-tailed t test). Bars represent median values, boxes signify the upper (Q3) and lower (Q1) quartiles, and whiskers are located at 1.5 the interquartile range

