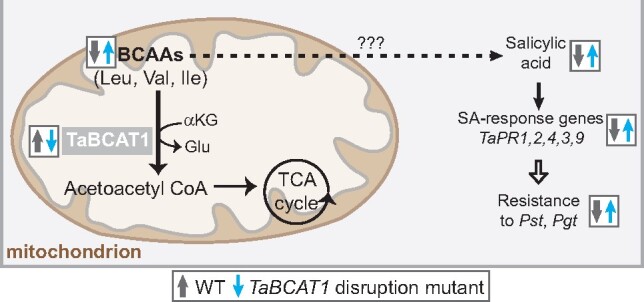
Figure 9.

Model illustrating the role of TaBCAT1 in the defense response. Disruption of TaBCAT1 (downward blue arrow) leads to an elevation in BCAA levels, free SA accumulation and enhanced expression of pathogenicity-related genes (TaPR1, 2, 4, 3, and 9), stimulating an increase in resistance to Pst and Pgt infection (upward blue arrows). The connection between elevated BCAAs and SA is currently unknown (dotted arrow). In contrast, wild type (WT) expression of TaBCAT1 (upward gray arrow) leads to lower levels of BCAAs, SA, PR gene expression, and resistance to Pst (downward gray arrows)
