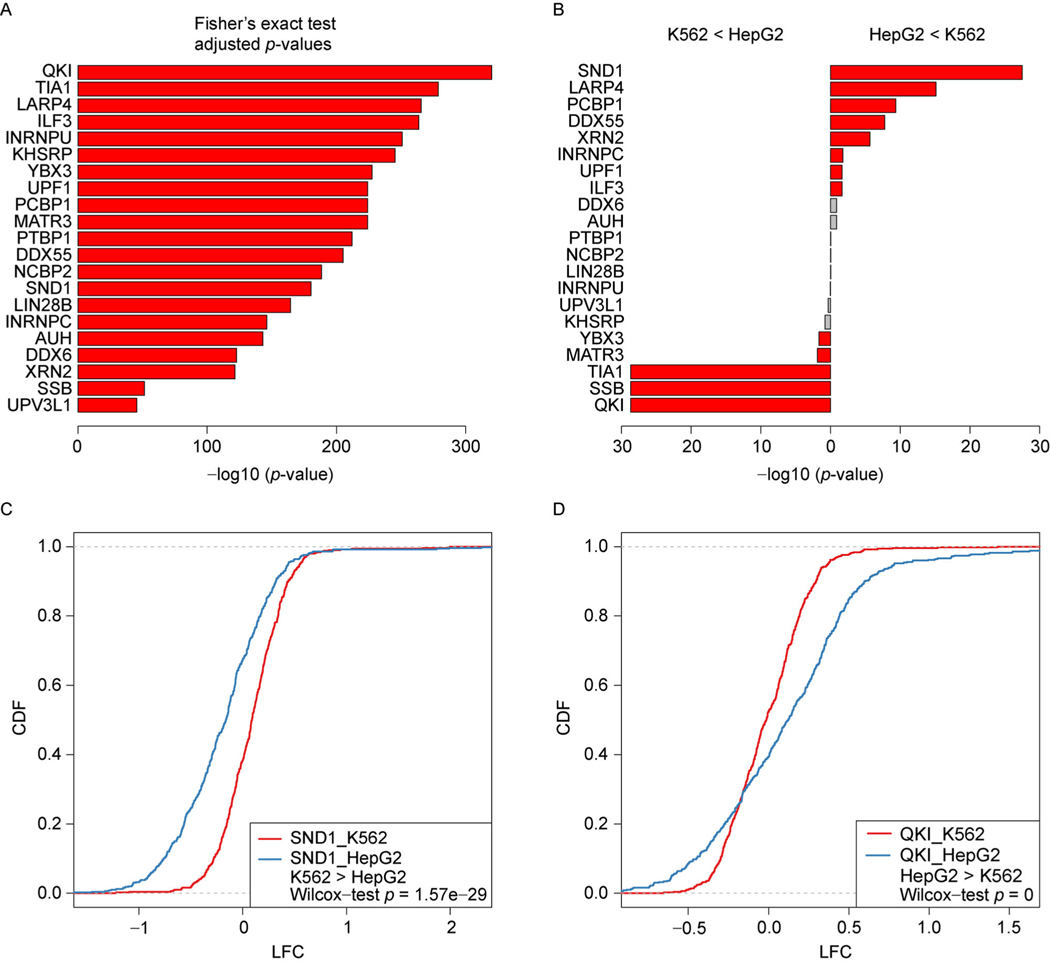
Figure 5. Cell type-specific regulation of RBPs.
(A) The overlap between K562 and HepG2 on the top 500 ranked targets based on the PRAS scores for the mRNA decay related RBPs. (B) Statistical significance of the difference of the gene expression LFCs between the top 500 ranked targets based on the PRAS scores in K562 and HepG2. (C) The CDFs of the gene expression LFCs for the top 500 ranked targets based on the PRAS scores in K562 and HepG2 for SND1. (D) Same as (C) for QK1.

