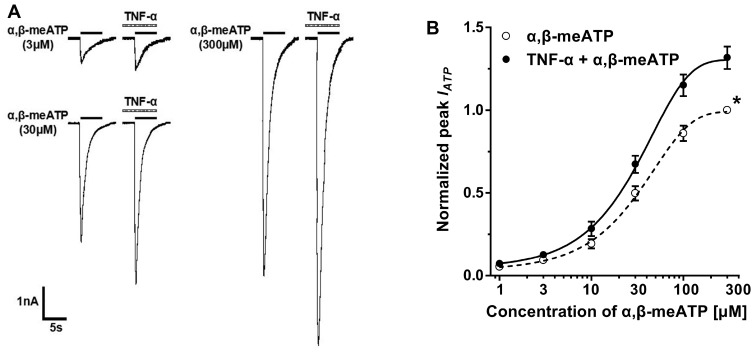
Figure 2.
TNF-α shifted upwards the concentration–response curve for α,β-meATP. (A) Original currents show that TNF-α (10 ng/mL) pretreatment increased the currents induced by three different concentrations of α,β-meATP. (B) The graph shows concentration–response curves for α,β-meATP in the absence and presence of TNF-α (10 ng/mL). Both curves were fit by the Hill equation. Each point represents the mean ± S.E.M. of 7–10 neurons. All peak current values from the same cell were normalized to the current response induced by 300 μM α,β-meATP applied alone in the absence of TNF-α (marked with asterisk). The figure shows averaged data fitted with the Hill equation. The curves shown are a best fit of the data to the logistic equation I = Imax/[1 + (EC50/C)n], where C is the concentration of α,β-meATP, I is the normalized current response value, EC50 is the concentration of α,β-meATP for half-maximal current response, and n is the Hill coefficient.

