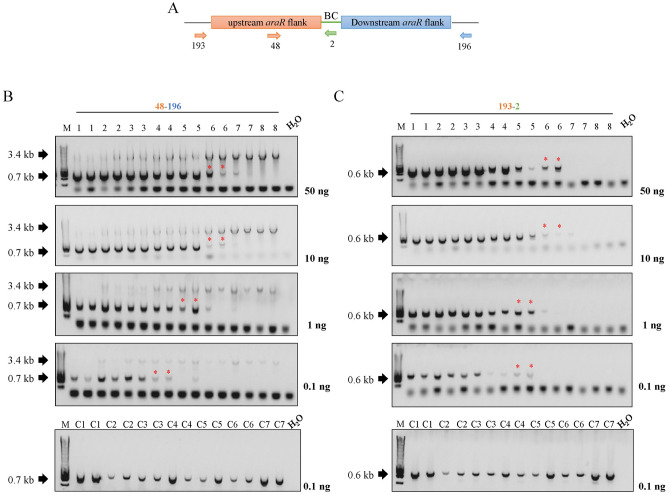
Fig. 5.
Study of the traceability of barcoded mutants in conidia populations. a Schematic representation of the primer locations in the barcoded ∆araR mutants. b PCR results for the traceability of the barcoded ∆araR mutants using primer pair 48-196. c PCR results for the traceability of the barcoded ∆araR mutants using primer pair 207-196. Lower bands (0.6, 0.7 kb) correspond to the mutants, whereas the higher bands (3.4 kb) correspond to the reference strain. The numbers in the wells correspond to the conidia combinations shown in Table 4. Amount of DNA used for each analysis is shown next to the corresponding electrophoresis gel. Asterisk (*) represents the lowest tested concentration in which the mutant can be detected. M: molecular weight marker (HyperLadder™ 1 kb, Bioline)

