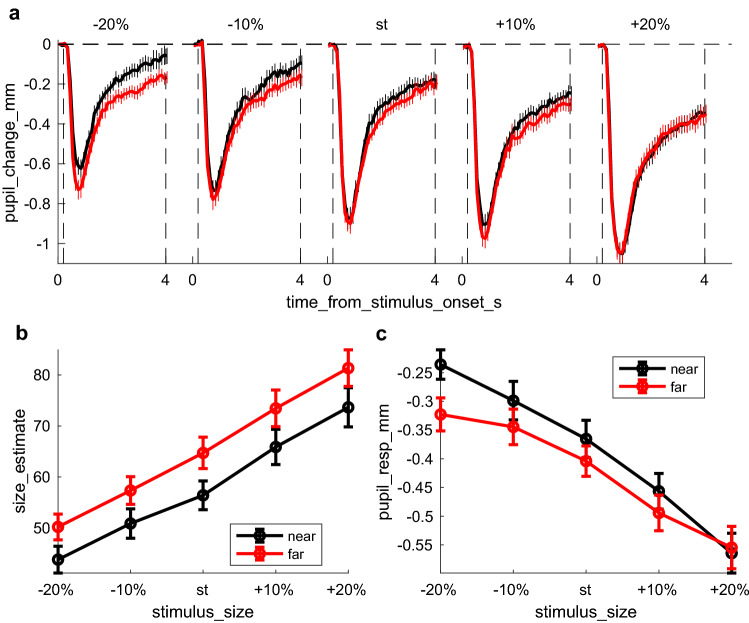
Fig. 2.
Ponzo illusion measured with perceptual reports and pupillary responses. a Timecourses of pupil change relative to baseline (first 200 ms from stimulus onset), plotted separately for the near (black) and far (red) conditions and for the five stimulus sizes (from ± 20% the standard size); dashed lines indicate the window over which pupil changes are averaged to compute the pupil response (whole trial duration except the initial 200 ms used to define pupil baseline). Thick lines show averages across participants, thin lines ± 1 s.e.m. b Mean magnitude estimates of the figurine size. Separate lines are for the near (black) and far (red) conditions and estimates are plotted against stimulus size, with error bars giving standard errors across participants. c Mean pupil responses (pupil change averaged in the window defined by dashed vertical lines in a, corresponding to the whole stimulus duration except the initial 200 ms used to define pupil baseline). Same format as in b

