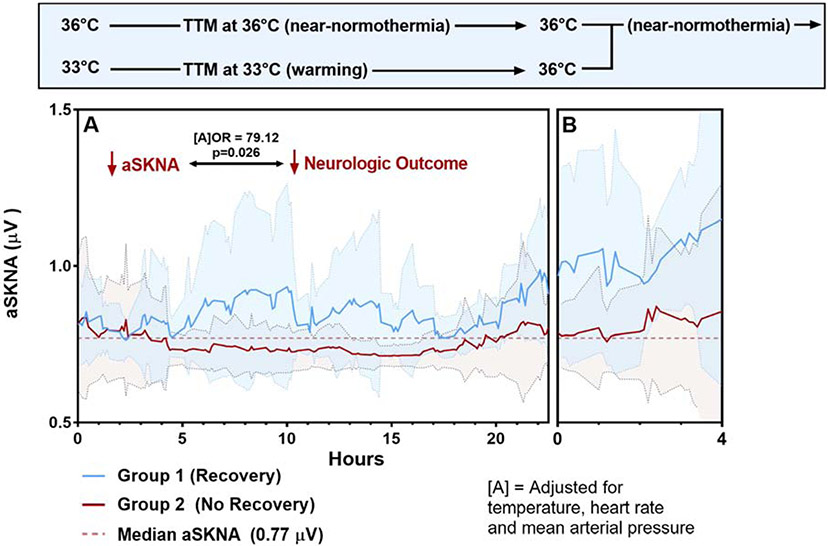
Figure 2: SKNA during the rewarming TTM protocol.
(A) Represents the warming phase of TTM at 33°C (n=23), while (B) represents the near-normothermia phase of TTM at 33°C and 36°C (n=29). At all hourly timepoints, an aSKNA value under 0.77 was associated with poor neurologic status post intervention even after adjusting for mean temperature, HR, and MAP values (OR=79.12, p=0.026). Background color related to each curve represents standard deviation.

