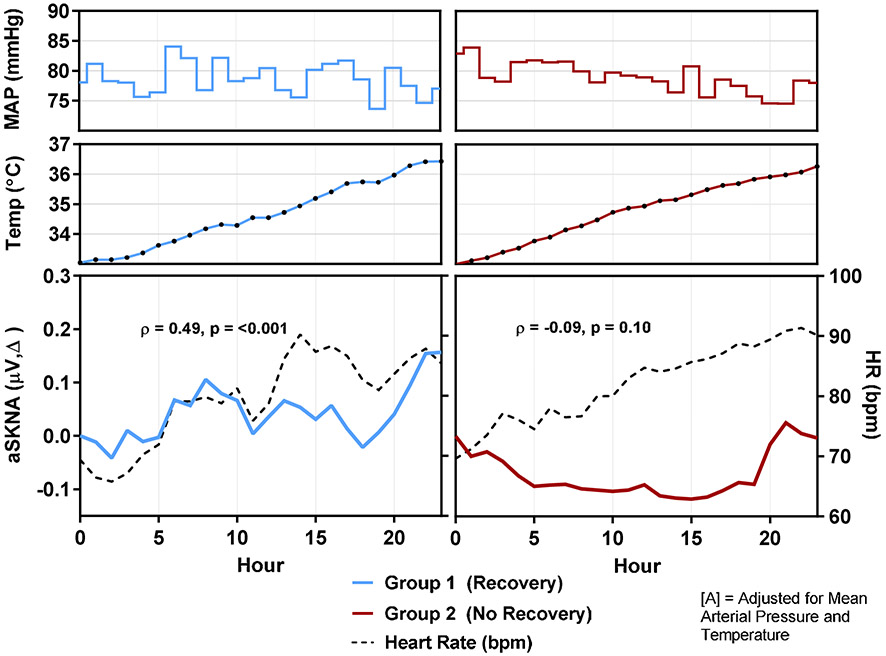
Figure 4: SKNA and HR during Warming.
During TTM at 33°C, for both groups, MAP remained within 74-84 mmHg and temperature steadily increased throughout warming. As a whole, changes in aSKNA and HR tended to increase or decrease simultaneously in Group 1 and were significantly correlated (Spearman's correlation coefficient, ρ = 0.49, p<0.001), unchanged even when adjusting for corresponding MAP and temperature values (p=0.017). In Group 2, there was no significant relationship between changes in aSKNA and HR (ρ = −0.09, p=0.10).

