
Figure 2. Representative responses to Crizotinib monotherapy in patients with activating Arg1275Gln ALK mutation.
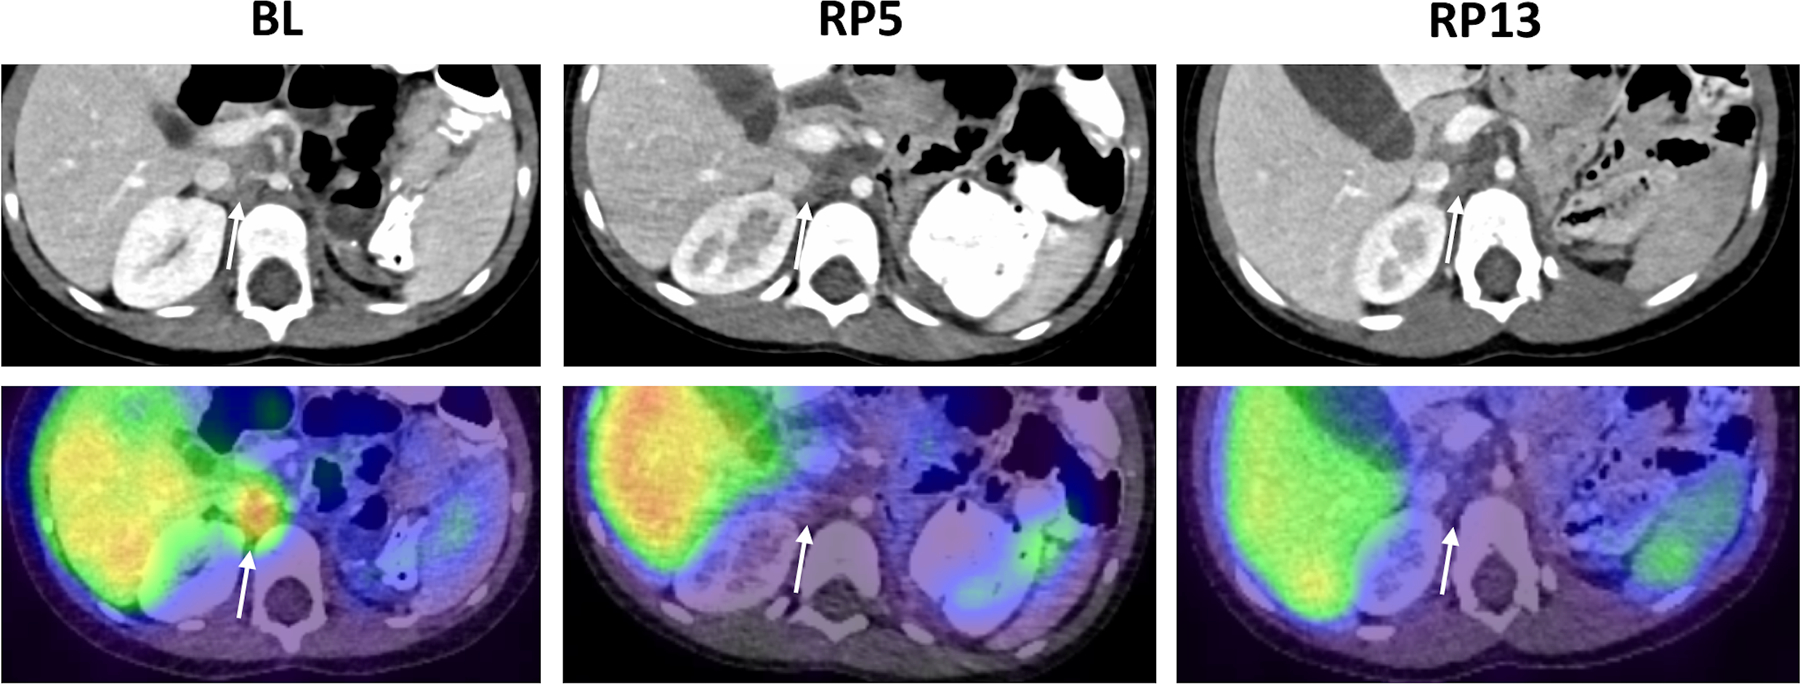
A. Patient 114. Diagnostic CT (upper row) and 123I-MIBG SPECT/CT images (lower row) show response of an enlarged right aortocaval lymph node (arrows) to Crizotinib therapy. Images obtained at baseline and after 5 and 13 cycles of therapy, respectively, show a partial response at RP5, and a complete response at RP13, with no residual lymphadenopathy or MIBG uptake at RP13. A similar pattern of response was also shown for a separate site of retroperitoneal disease (not shown).
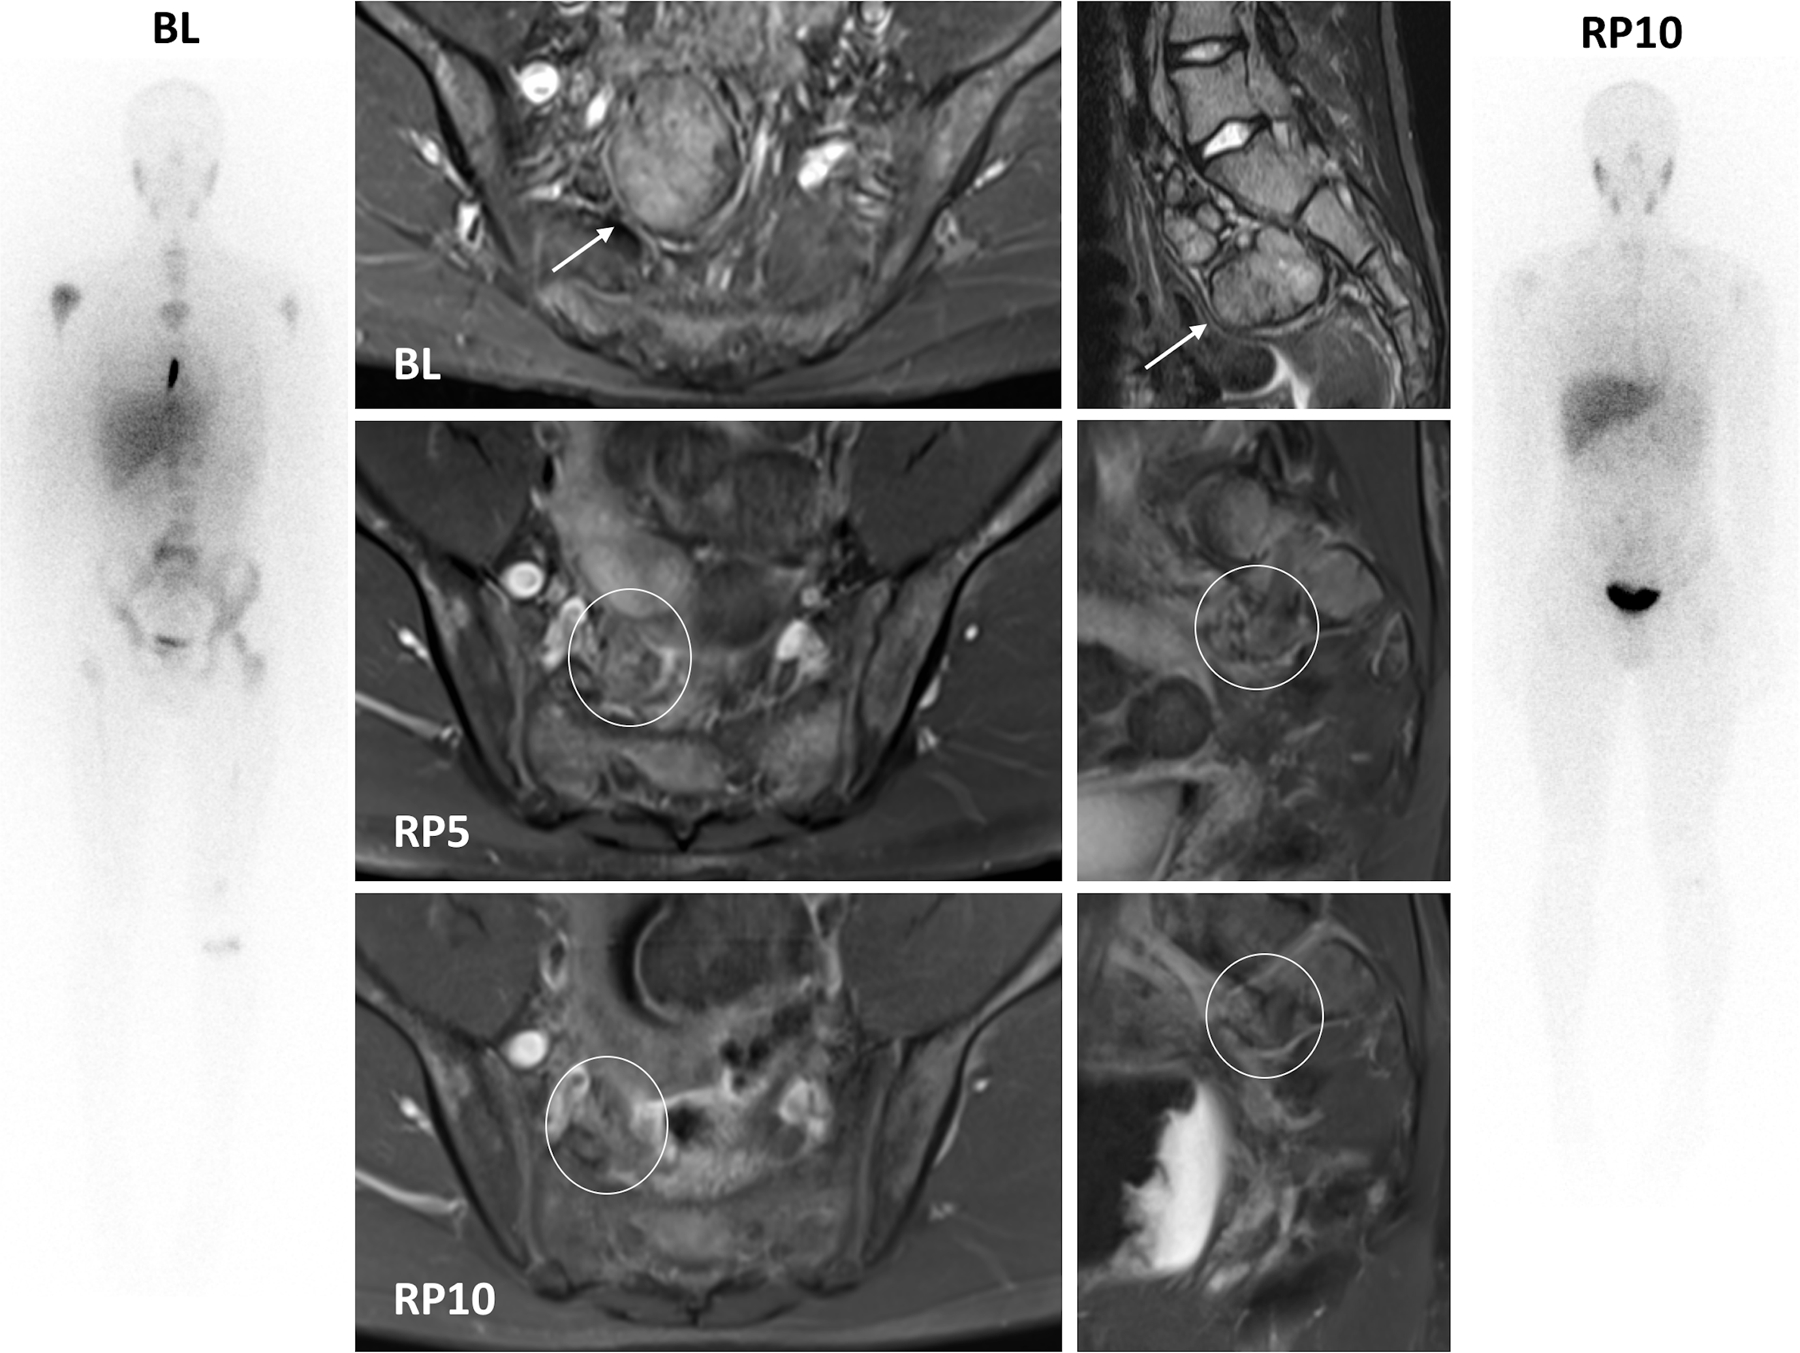
B. Patient 121. Whole body MIBG planar images (outer panels), axial (inner left panels) and sagittal (inner right panels) fat-suppressed T2 weighted MRI images show partial response of measurable disease by MRI and MIBG-avid evaluable disease to Crizotinib therapy. The pre-sacral mass present at baseline (BL, arrow) has decreased significantly in size, with only a small focus of measurable disease (circle) remaining by RP10. Multiple sites of MIBG avid disease, including the pre-sacral soft tissue mass, left parietal skull, entire vertebral column, proximal humeri, bony pelvis, proximal femurs, distal left femur and proximal left tibia, have either resolved (left parietal skull) or are significantly decreased in signal intensity, with only faint uptake remaining at sites of baseline MIBG avid disease.