
Figure 3: GFP-emerin mutants that disrupt binding to nucleoskeletal partners fail to rescue nuclear area.
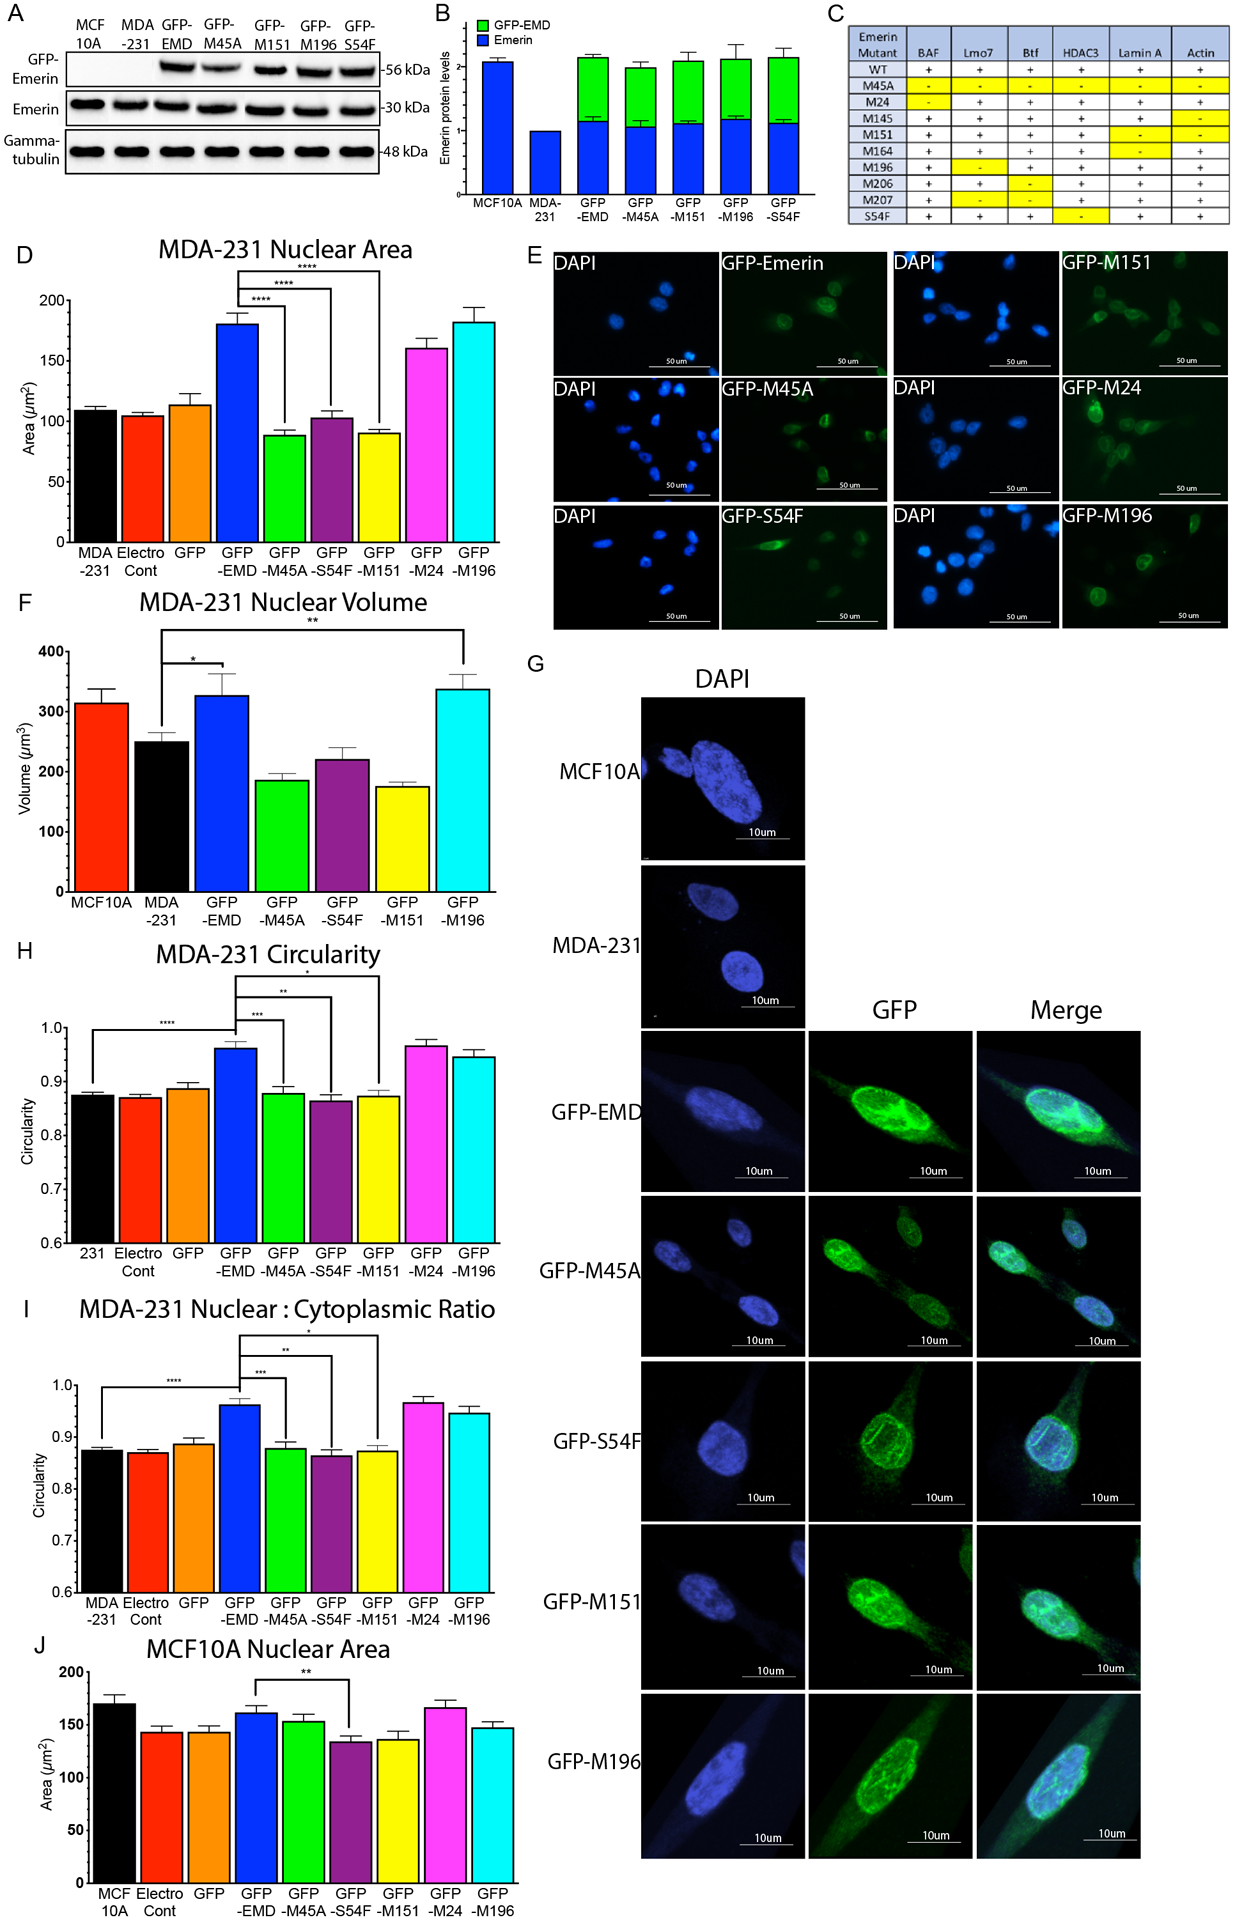
(A) Western blot of MCF10A cells, MDA-231 cells and MDA-231 cells stably expressing GFP-emerin or each GFP-emerin mutant. (B) Endogenous emerin, GFP-emerin and total emerin protein expression was normalized to gamma-tubulin and wildtype emerin in MDA-231 cells. Error bars represent standard deviation. (C) Panel showing known emerin-binding proteins and their disruption by the indicated emerin mutant protein. +, indicates emerin mutant binds to specific binding partner; -, indicates emerin mutant disrupts binding to the protein [58]. Disruptions are highlighted in yellow for clarity. (D) Nuclear area of MDA-231 cells (n=237, black), MDA-231 cells with no plasmid, but electroporated (electroporation control; n=195, black), and MDA-231 cells expressing GFP (n=53, orange), GFP-emerin (n=157, blue), GFP-M45A (n=142, green), GFP-S54F (n=145, purple), GFP-M151 (n=155, yellow), GFP-M24 (n=158, pink) or GFP-M196 (n=149, cyan). Error bars represent standard error. ****p-value < 0.0001, one-way ANOVA. (E) Representative DAPI (blue) and GFP (green) images for GFP-emerin and each GFP-emerin mutant analyzed in D. Scale bars: 50 μm. (F) Nuclear volume of MCF10A cells (n=25, red), MDA-231 cells (n=29, black), and MDA-231 cells expressing GFP-emerin (n=32, blue), GFP-M45A (n=22, green), GFP-S54F (n=28, purple), GFP-M151 (n=26, yellow), and GFP-M196 (n=19, cyan). Error bars represent standard error. **p-value = 0.0030, *p-value = 0.041, one-way ANOVA. (G) Representative DAPI (blue), GFP (green), and merged images for MCF10A cells, MDA-231 cells and MDA-231 cells expressing GFP-emerin or each GFP-emerin mutant analyzed in F. Scale bars: 10 μm. (H) Nuclear circularity of MDA-231 cells (n=55, black) and MDA-231 cells expressing GFP-emerin (n=52, blue), GFP-M45A (n=53), green), GFP-S54F (n=50, purple), GFP-M151 (n=49, yellow), GFP-M24 (n=44, pink), or GFP-M196 (n=59, cyan). Error bars represent standard error. *p-value = 0.0035, **p-value = 0.0005, ***p-value = 0.0225, ****p-value < 0.0001, one-way ANOVA (I) Ratio of nuclear to cytoplasmic area in MDA-231 cells (n=61, black) and MDA-231 cells expressing GFP-emerin (n=63, blue), GFP-M45A (n=45, green), GFP-S54F (n=65, purple), GFP-M151 (n=55, yellow) or GFP-M196 (n=54, cyan). Error bars represent standard error. *p-value = 0.051, **p-value = 0.035, ****p-value < 0.0001, one-way ANOVA. (J) Nuclear area of MCF10A cells (n=65, black), MCF10A cells with no plasmid, but electroporated (electroporation control; n=45, red), and MCF10A cells expressing GFP (n=90, orange), GFP-emerin (n=76, blue), GFP-M45A (n=90, green), GFP-S54F (n=91, purple), GFP-M151 (n=72, yellow), GFP-M24 (n=72, pink) or GFP-M196 (n=72, cyan). Error bars represent standard error. **p-value = 0.0101, one-way ANOVA.