
Figure 6: Patients with invasive breast cancer have decreased emerin expression.
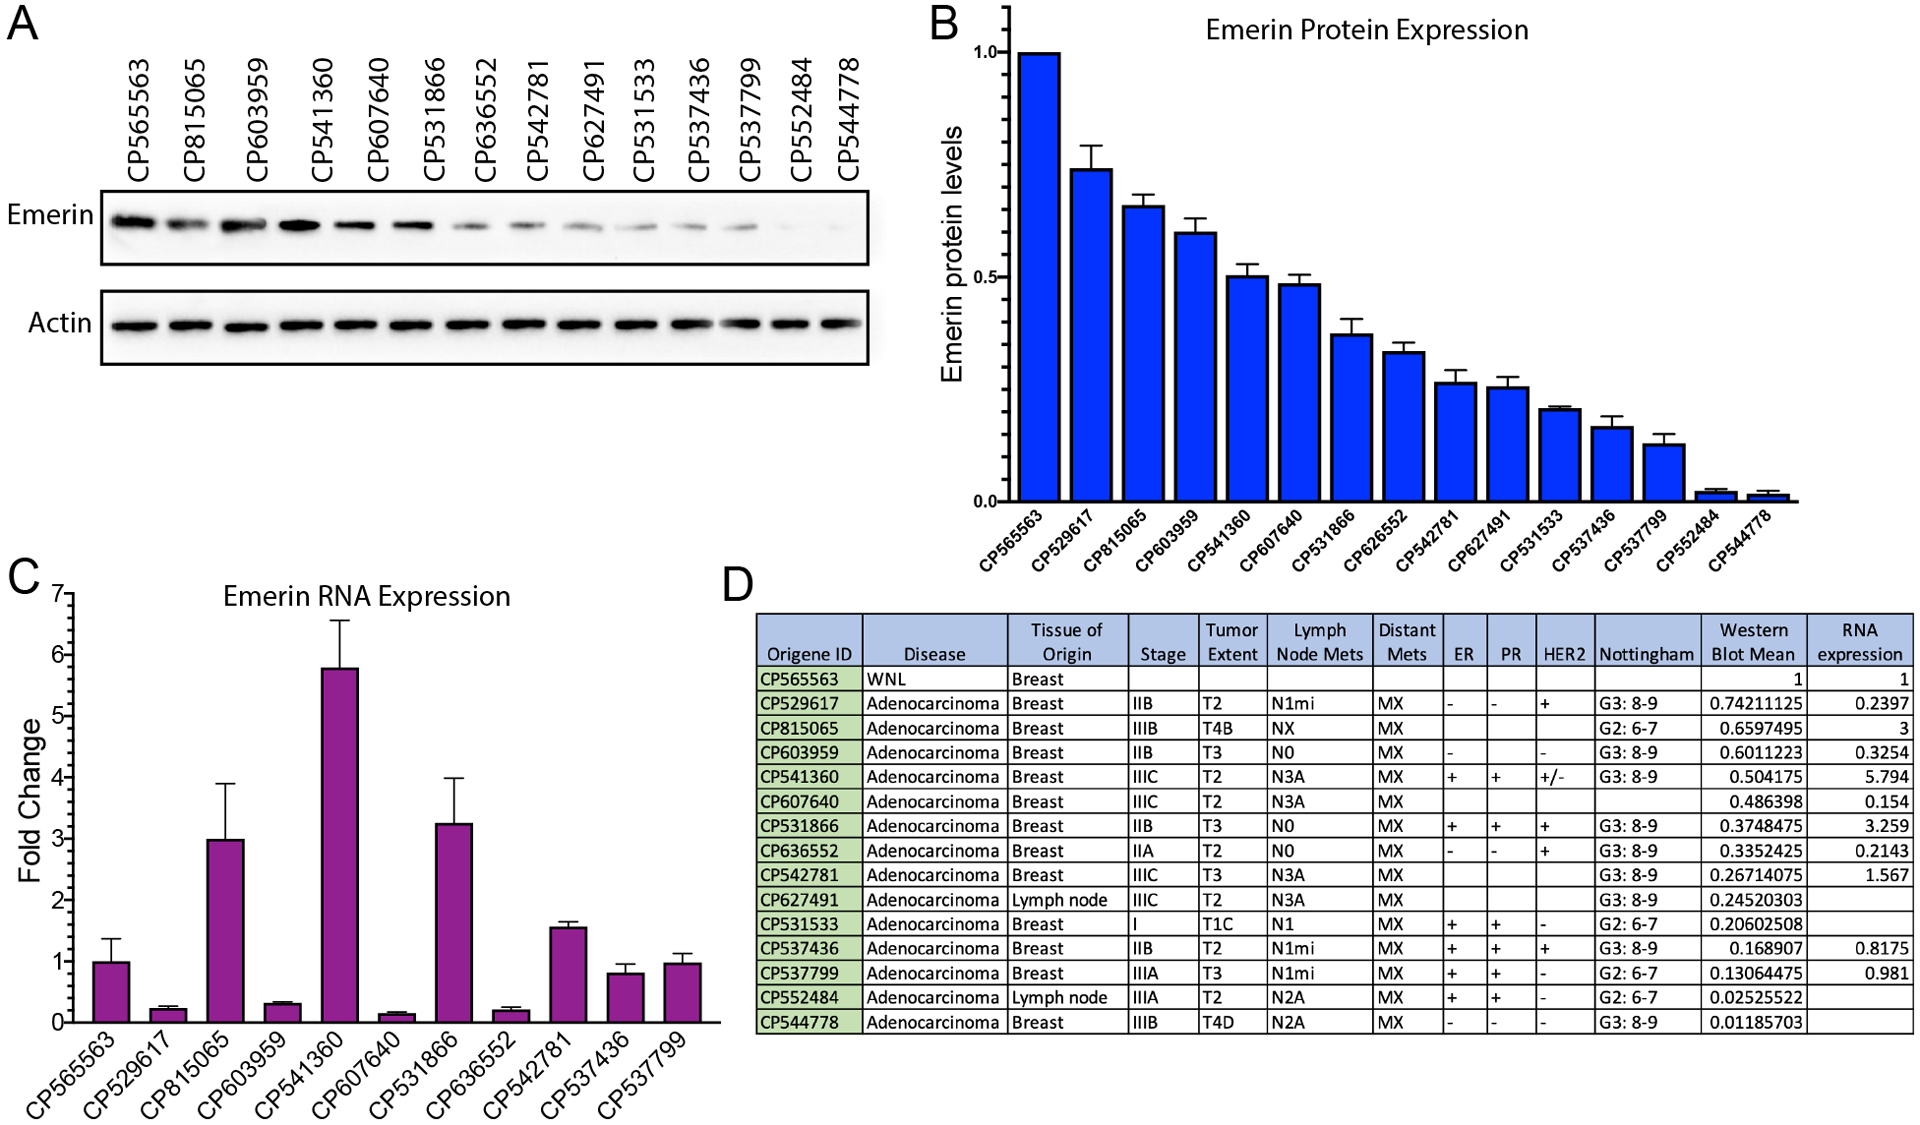
(A) Western blot analysis of protein lysates from a patient without breast cancer (control; CP565563) or from breast cancer patients. (B) Quantitation of protein lysates. Bands were normalized to actin and a patient without breast cancer (n=3). Error bars represent standard deviation. (C) qPCR analysis of matched RNA samples from one normal control patient sample and ten breast cancer patients. Samples were normalized to GAPDH and control patient sample without breast cancer. Error bars represent standard deviation. (D) Summary panel of patient tumor information.