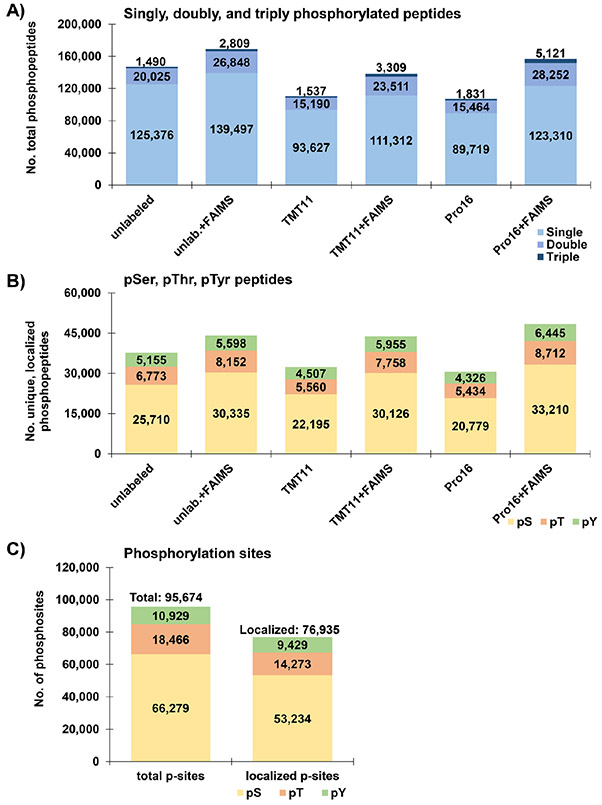
Figure 4.
Characteristics of Fe2+-NTA-enriched phosphopeptide data sets. (A) Bar graphs illustrating the number of singly, doubly, and triply phosphorylated peptides across the six phosphopeptide data sets. (B) Bar graphs summarizing the number of phosphopeptides with at least one phosphorylated serine (pSer), threonine (pThr), and tyrosine (pTyr) residue across the six data sets. (C) Bar graph depicting the number of identified and localized phosphorylation sites for all six data sets. We tally the numbers of serine (pSer), threonine (pThr), and tyrosine (pTyr)-centered motifs for phosphorylation sites with a single phosphorylation site per peptide.

