Figure 1.
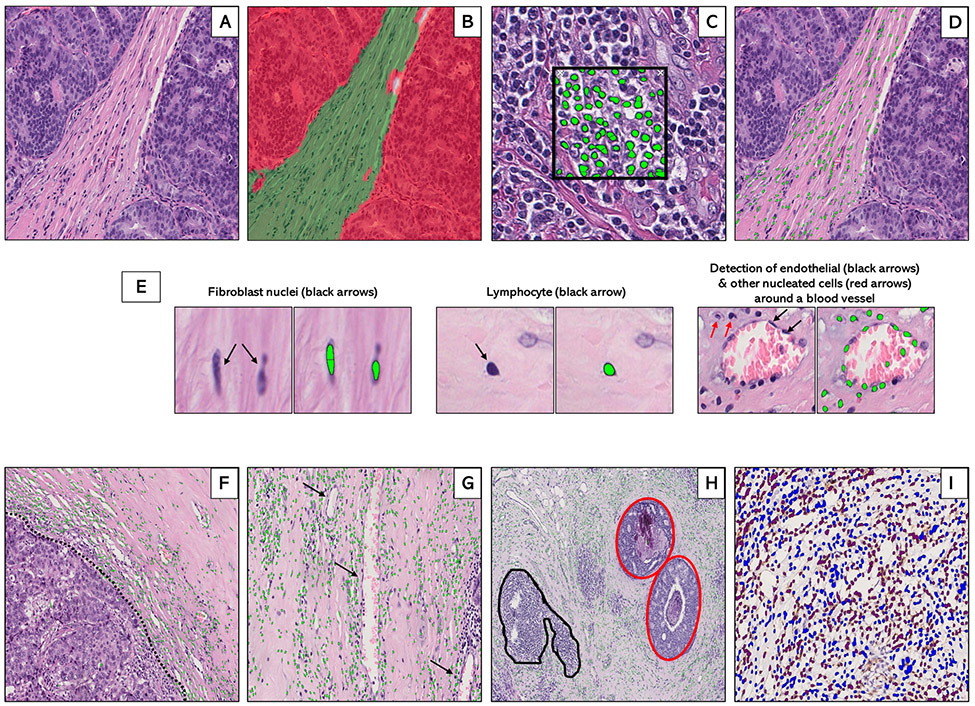
Supervised machine learning for tissue segmentation and cell detection in breast cancer hematoxylin and eosin (H&E)-stained whole tissue sections. Machine-learning algorithms were applied to digitized hematoxylin and eosin (H&E)-stained sections (A) to generate data on stromal cellular density. First, an optimized tissue classification script was used to segment the tumor into epithelial (red) and stromal (green) areas (B). Next, a cell detection script was trained to segment and detect cells (green dots) based on color deconvolution as well as nuclear characteristics (C). Tissue classification and cell detection scripts were combined to enable cell detection to be limited to the stromal compartment (D). Examples of individual stromal cells, including fibroblasts, lymphocytes, and endothelial cells are also shown (E). In general, the machine counted stromal cells (green dots) at the tumor-stroma border (F: dotted black line), around blood vessels (G: black arrows) and in the stroma surrounding foci of ductal carcinoma in-situ (H: inset, red) while excluding tertiary lymphoid structures and lymphoid aggregates (H: inset, black). For a subset of patients with immunohistochemical staining on CD3+ and CD8+ T-cells, optimized scripts were used to quantify the densities of IHC-positive (brown) and IHC-negative (blue) cells within the stroma (I).

