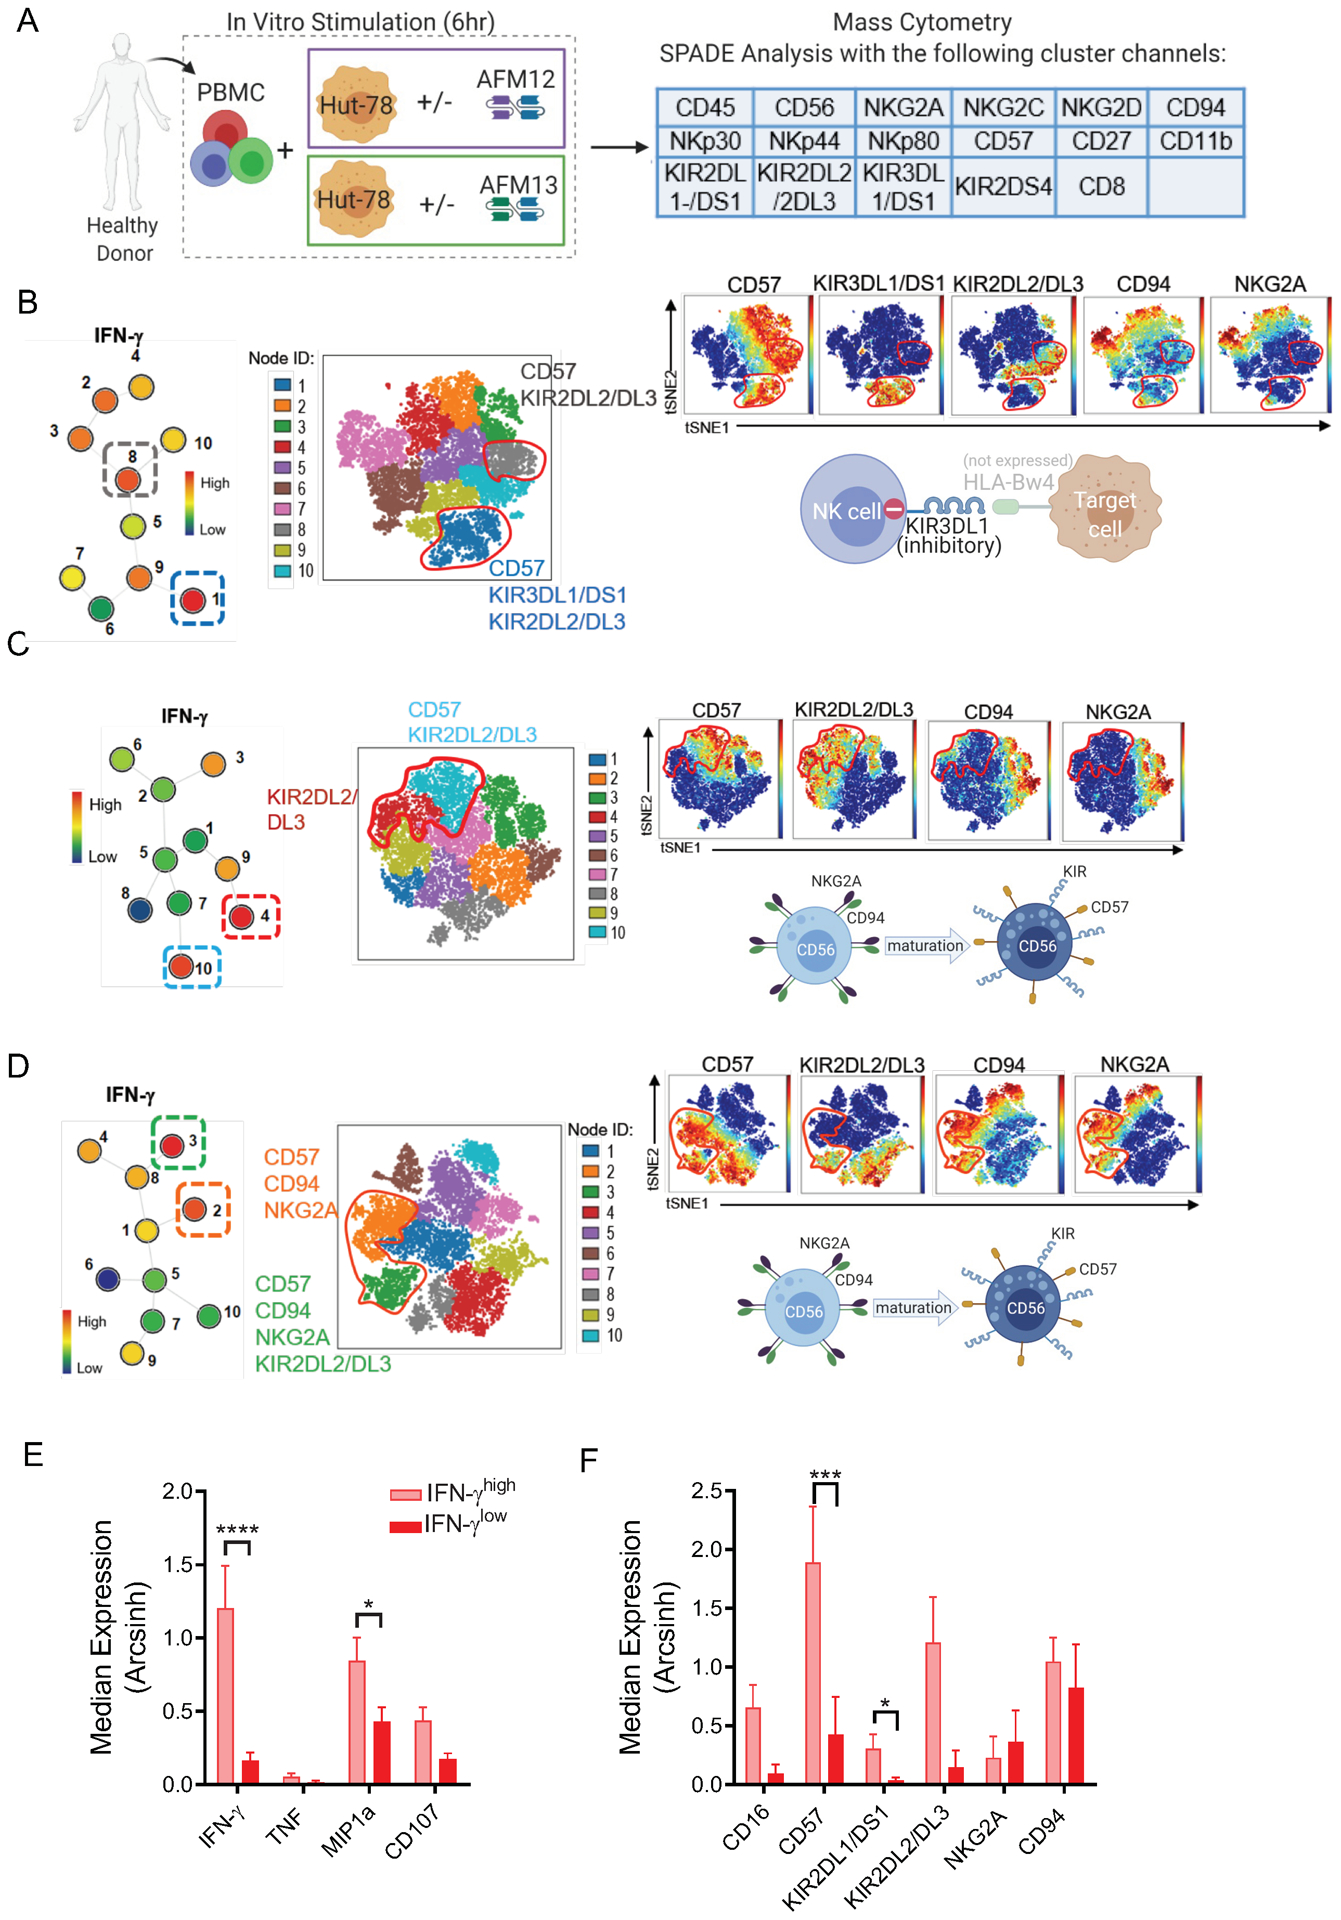
Fig. 2. AFM13-induced functional response is impacted by underlying NK cell subsets and NK repertoire.

(A) Schema of cell stimulation to evaluate functionality and phenotype of cNK cells responding to AFM13 triggering. Clustering channels included for SPADE analysis are shown. B-D) Representative examples of SPADE analysis from 3 different donors showing the expression of KIRs, CD57 and CDK2A/CD94 in the top 2 nodes with highest IFN-γ expression in response to AFM13. Numbers next to each node represent the node ID and color indicates IFN-g median expression. For each donor, selected nodes were backgated to their own viSNE plots to identify their phenotype. (B) IFN-γ production (nodes 1, 8) in this donor was restricted to mature CD57+KIR2DL2/DL3+ NK cells. In this donor, lack of HLA-Bw4 expression in HuT-78 cells correlates with a robust response of KIR3DL1/DS1+ NK cells. (C) The highest IFN-γ production was restricted to terminally matured CD57+KIR2DL2/3+NKG2A- NK cells in this donor. (D) IFN-γ (nodes 2, 3) was produced by both mature and immature NK cells (CD57+NKG2A+CD94+KIR+/−) NK cells in this donor. (E) Median expression of IFN-γ, TNF, MIP1α, CD107a and (F) NK cell markers associated with cell maturation or differentiation in nodes with the highest and lowest IFN-γ median expression per donor. In F, all donors were positive for the depicted KIR. Consolidated data of 10 donors. Bars represent mean ± SEM. *p<0.05, **p<0.01, ***p<0.001, ****p<0.0001. One-way ANOVA with Tukey pots-hoc test. n=10.
