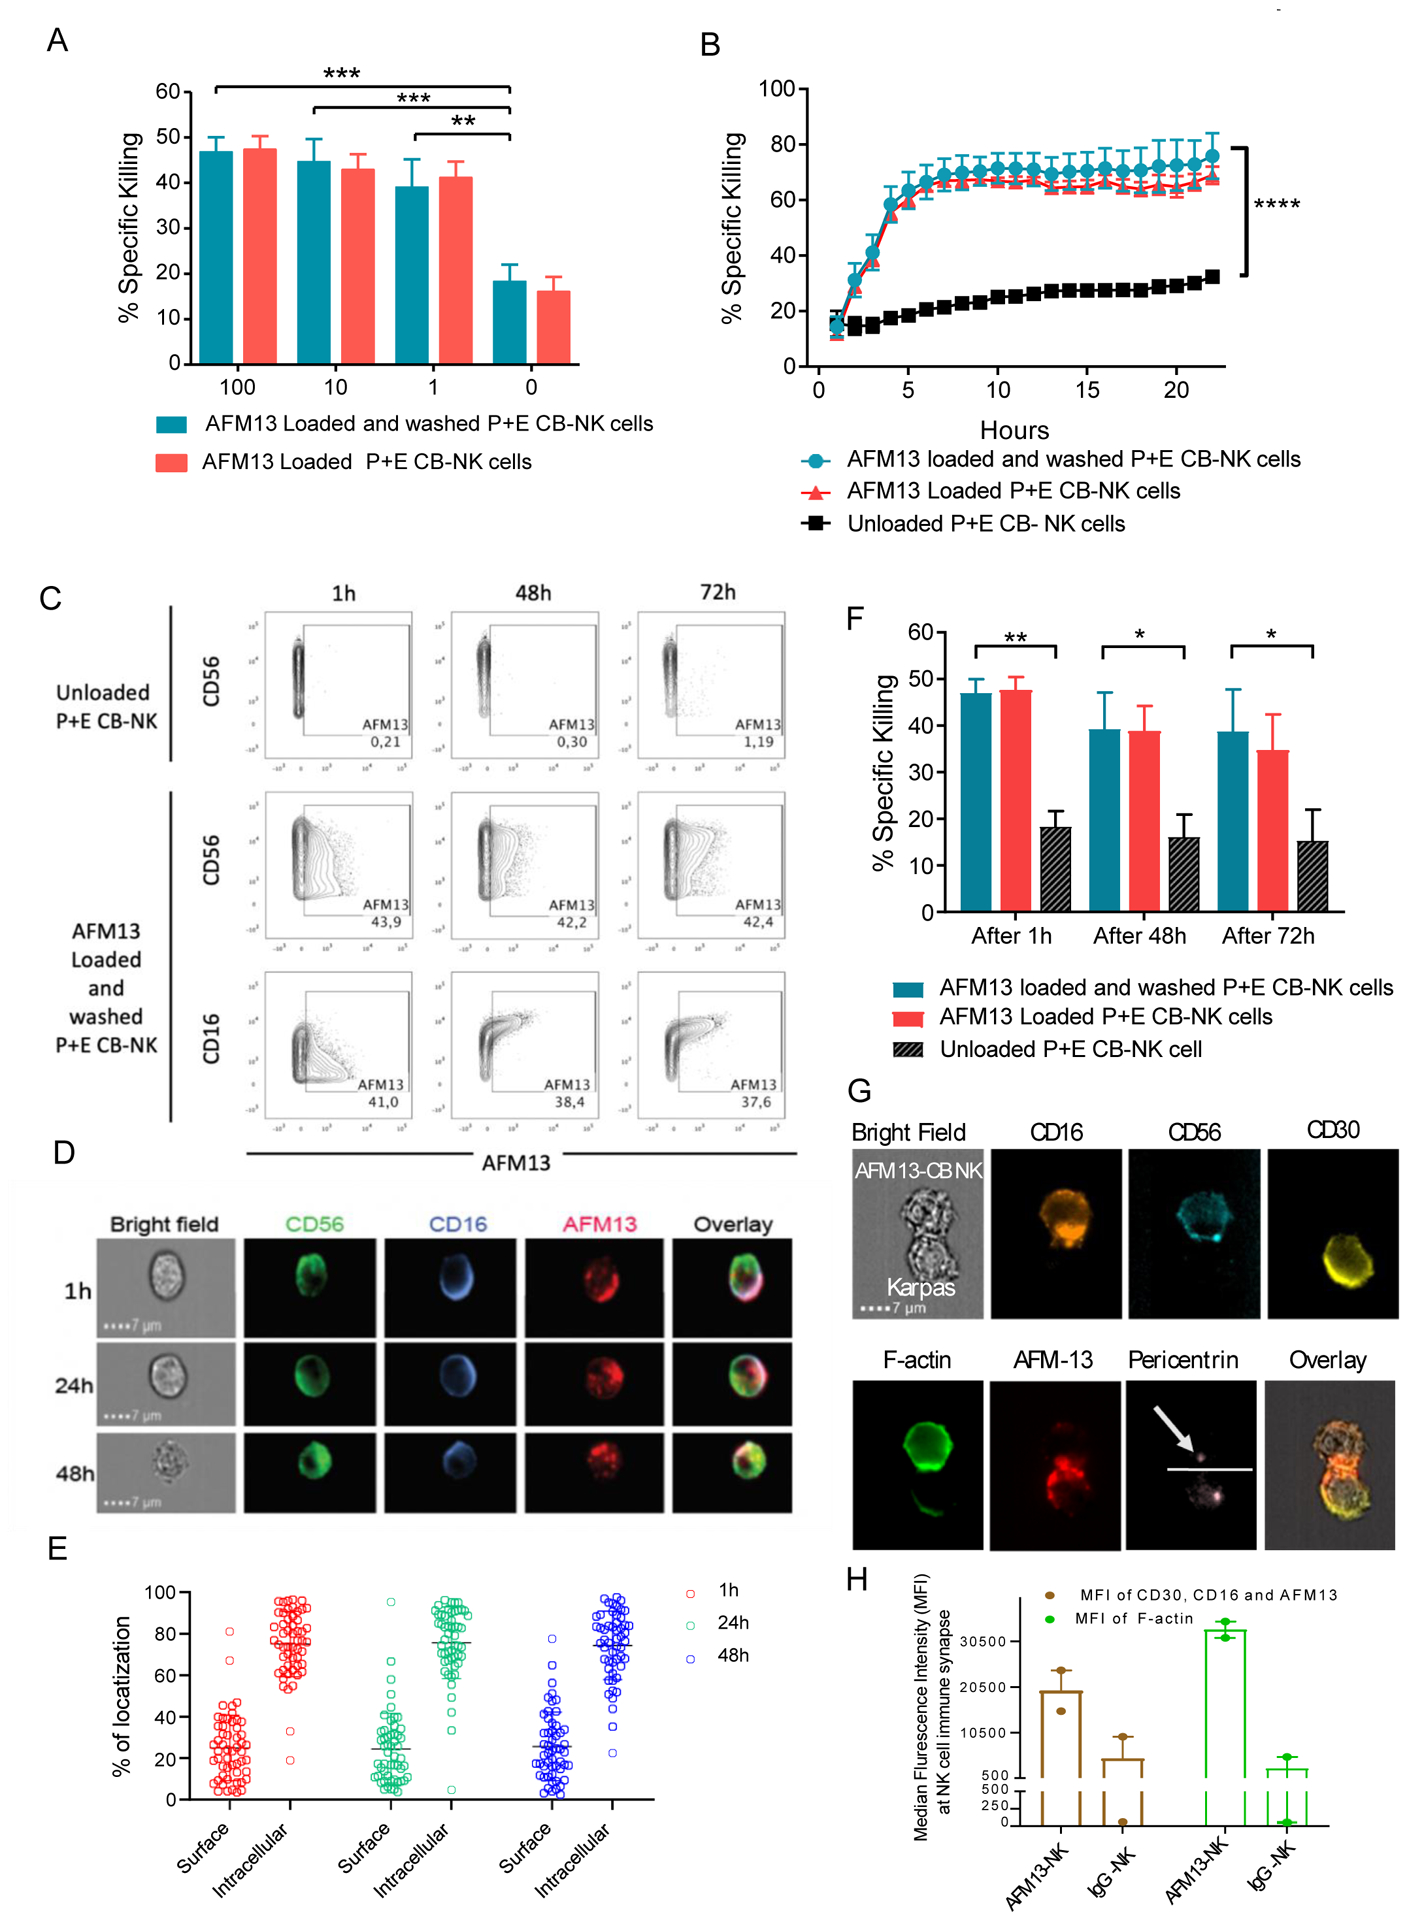
Fig. 5. Retention of AFM13 on NK cell surface enhances cytotoxicity against CD30 positive Karpas 299.

(A) Cytotoxicity (4 hour 51Cr-release assay) of CB-NK cells loaded with AFM13 (0–100 μg/ml) that were either washed twice with PBS (blue bars) or left unwashed (red bars) against Karpas 299 cells at E:T ratio 10:1. (B) Karpas 299 killing over a 24 hour period by AFM13 (100 μg/ml) loaded and washed (blue lines), or unwashed (red lines), along with unloaded (black lines) CB-NK cells as measured by incuCyte. (C) For cell surface retention assays, 1×10⁶ human P+E CB-NK cells were labeled with 100 μg/ml of AFM13 at 37°C for one hour, cells were washed. At the indicated timepoints, the presence of AFM13 was measured using anti-AFM13 antibody followed by an APC-conjugated goat anti-rat IgG. The retention of AFM13 was evaluated by flow cytometry. (D) The retention of AFM13 on unwashed NK cell surface was observed by Image Stream at different timepoints. A representative example of NK cell from each of the time points stained for CD56 (green), CD16 (blue), and AFM13 (red) along with an overlay of all fluorescent channels and bright field is shown. Scale bar=7μm. (E) Percent distribution of total AFM13 fluorescent signal is summarized from the images of 50 cells, which were randomly sampled from 1 hour (red), 24 hours (green), and 48 hours (blue) time points. Each dot represents a cell, horizontal line the mean and error bars indicate +/− SD. (F) P+E CB-NK cells were cultured without or with AFM13 (100 ug/ml) for 1 hour at 37°C, followed by either a wash step or not. The cells were then cultured in media plus 100 IU/mL of rhIL-2 for 1 hour, 48 hours, or 72 hours and their cytotoxicity tested against Karpas 299 target cells at an E:T ratio of 5:1. (G) Bright field image showing AFM13 labelled NK cells were conjugated with Karpas 299 cells. Staining of the conjugates for CD16 (orange), CD56 (teal), CD30 (yellow), F-actin (green), AFM-13 (red), pericentrin (light pink) and an overlay of the BF images with AFM13, CD30 and CD16 are shown. The dotted line defines the synapse and the arrowhead is pointing to the pericentrin in NK cells. Conjugates were evaluated under a 60x objective in ImageStream; scale bar = 7mm. (H) Synaptic localization of CD30, CD16 and AFM13 (Brown), along with polymerization of F-actin (Green) at the immune synapse between NK cells and Karpas299 cells in the presence of AFM13 or IgG control antibody is shown. Horizontal bars represent the average and error bars indicate the range. Bars represent mean ± SEM. Two-way ANOVA with Sidak post-hoc test ** p ≤ 0.01, ***p ≤ 0.001, **** p ≤ 0.0001. n=3–4.
