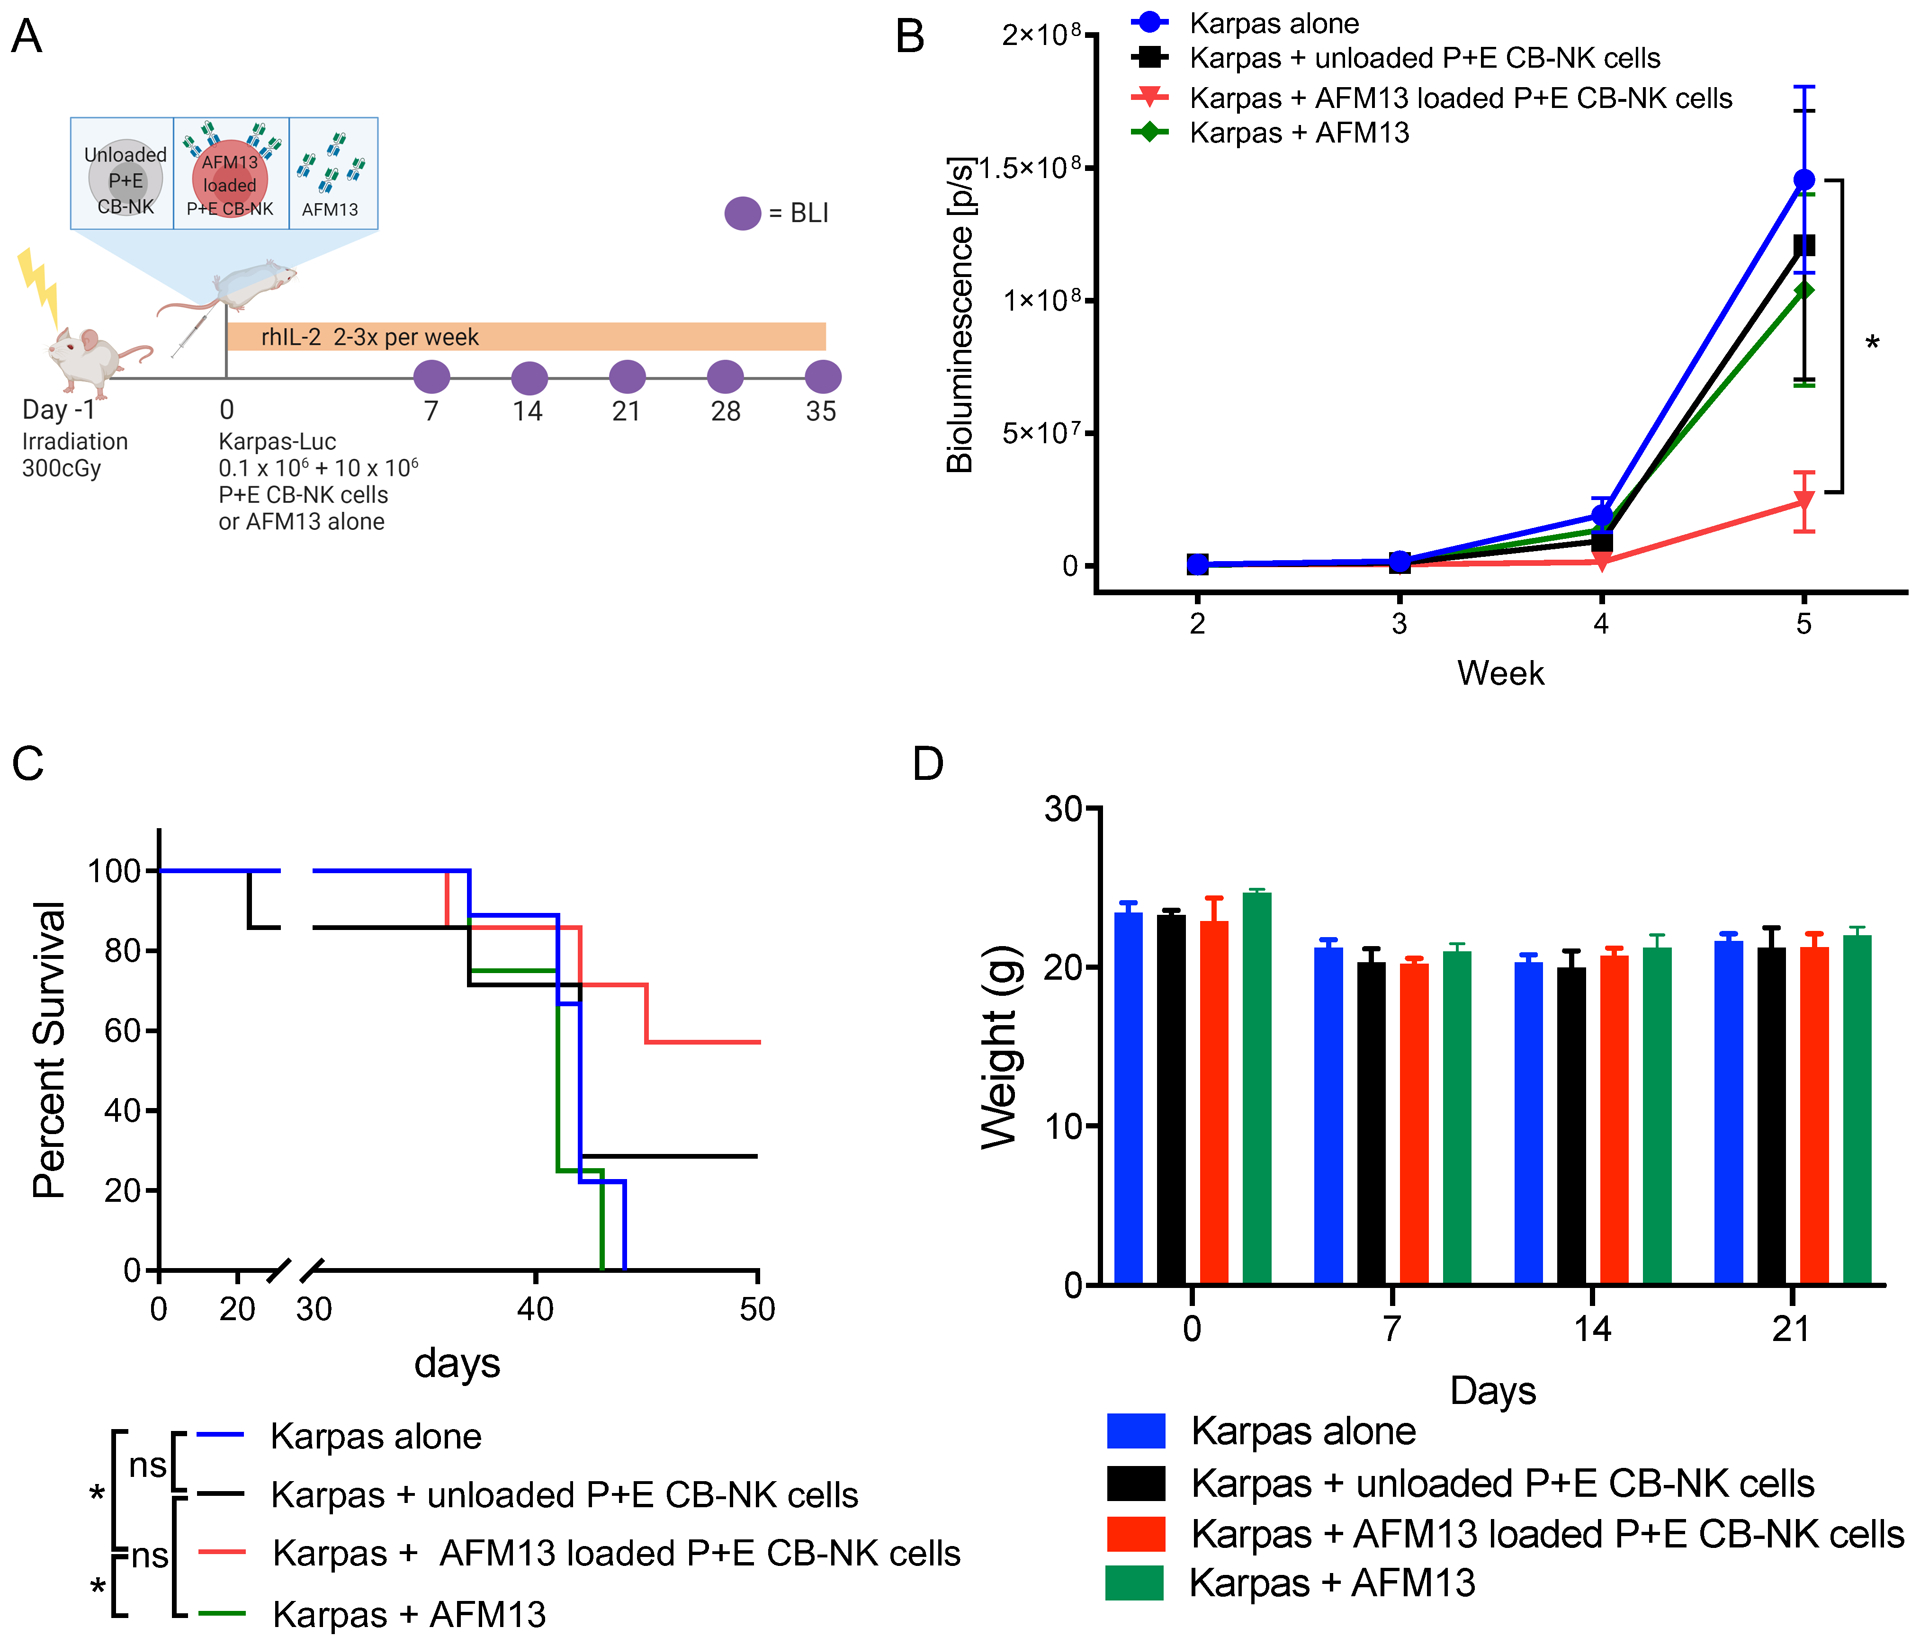
Fig. 6. In vivo antitumor activity of AFM13 loaded P+E CB-NK cells.

(A) Experimental schema applied to evaluate in vivo activity of AFM13. (B) Bioluminescence imagining (BLI) was used to monitor the growth of FFluc-labeled Karpas 299 tumor cells in NSG mice. The plot summarizes the bioluminescence data from four groups of mice treated with Karpas 299 alone, Karpas 299 plus one dose of unloaded NK cells (10 × 106), Karpas 299 plus one dose of AFM13 loaded (100 μg/ml) and washed NK cells (AFM13-NK cell complex; 10 × 106), or Karpas 299 and an injection of AFM13 (100 μg/ml). (C) Kaplan–Meier plots showing the survival of mice described in panel A. Mice treated with a single dose of 10 × 106 AFM13-NK cell complex (blue line) had better survival than control groups. (D) Bar plots summarize the weight of the animals over time as a measure of toxicity. Bars represent mean ± SEM. Two-way ANOVA with Tukey post-hoc test, *p ≤ 0.05; ns, not significant. n=4–9 mice per group, 2 independent experiments.
