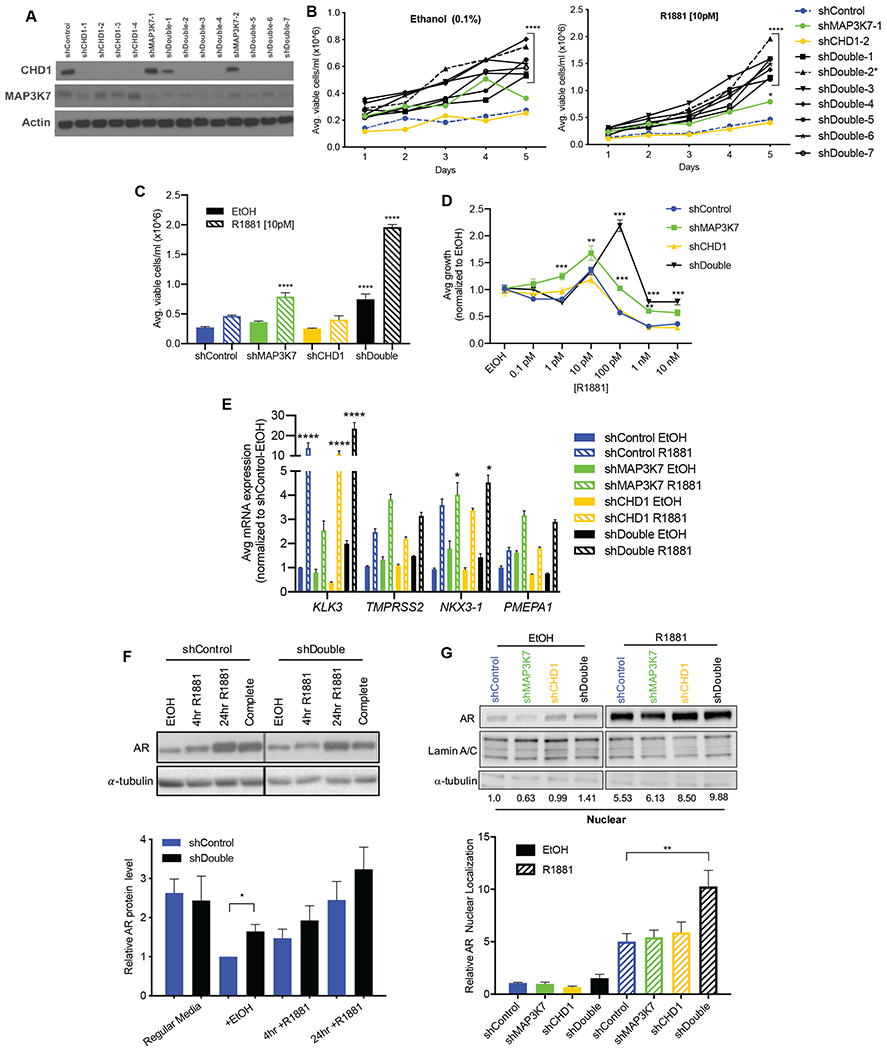
Fig 1. Co-suppression of MAP3K7 and CHD1 increases androgen-independent growth and AR activity.

(A) Western blot of shControl, shMAP3K7, shCHD1, and shMAP3K7-shCHD1 (shDouble) LNCaP cells. Multiple shRNA constructs are shown. (B) 5-day growth assay for LNCaP shControl, shMAP3K7, shCHD1, and various shDouble combinations in steroid-depleted medium with vehicle (0.1% EtOH) or 10 pM R1881. Asterick denotes shDouble (2) combination used in subsequent experiments. (n=3; p-value indicated for all shDouble constructs versus shControl at Day 5). (C) Quantification of day 5 from growth assay in B, including the shDouble-2 combination (n=3; p-values indicate comparison to shControl EtOH). (D) Day 7 of R1881 dose response curves for LNCaP cells normalized to respective EtOH treatment (n=3; p-values indicate comparison to shControl at each dose). (E) RT-qPCR of indicated genes in LNCaP cells cultured in steroid-depleted medium ± EtOH or 1 nM R1881 for 8 hr. Ct values normalized to B2M then to shControl (n=3; p-values represent comparison to shControl EtOH). (F) Quantification (n=3) and representative western blot of AR protein in shControl and shDouble LNCaP cell lysates isolated after different treatments: complete growth medium or steroid-depleted medium ± 1 nM R1881 for 4 hr or 24 hr. (G) Quantification (n=3) and representative western blot of AR protein in nuclear fractions isolated from LNCaP cell lysates after treatment with ± 1 nM R1881 for 4 hr. AR blot of EtOH-treated samples is shown at a higher exposure than R1881-treated samples in order to visualize bands. All data represent mean ± SEM; One-way ANOVA with Tukey’s multiple comparisons test (C, G), two-way ANOVA with Dunnett’s multiple comparisons test (B, D, E), and unpaired two-tailed t-test (F); *=p<0.05; **=p<0.01; ***=p<0.001; ****=p<0.0001.
