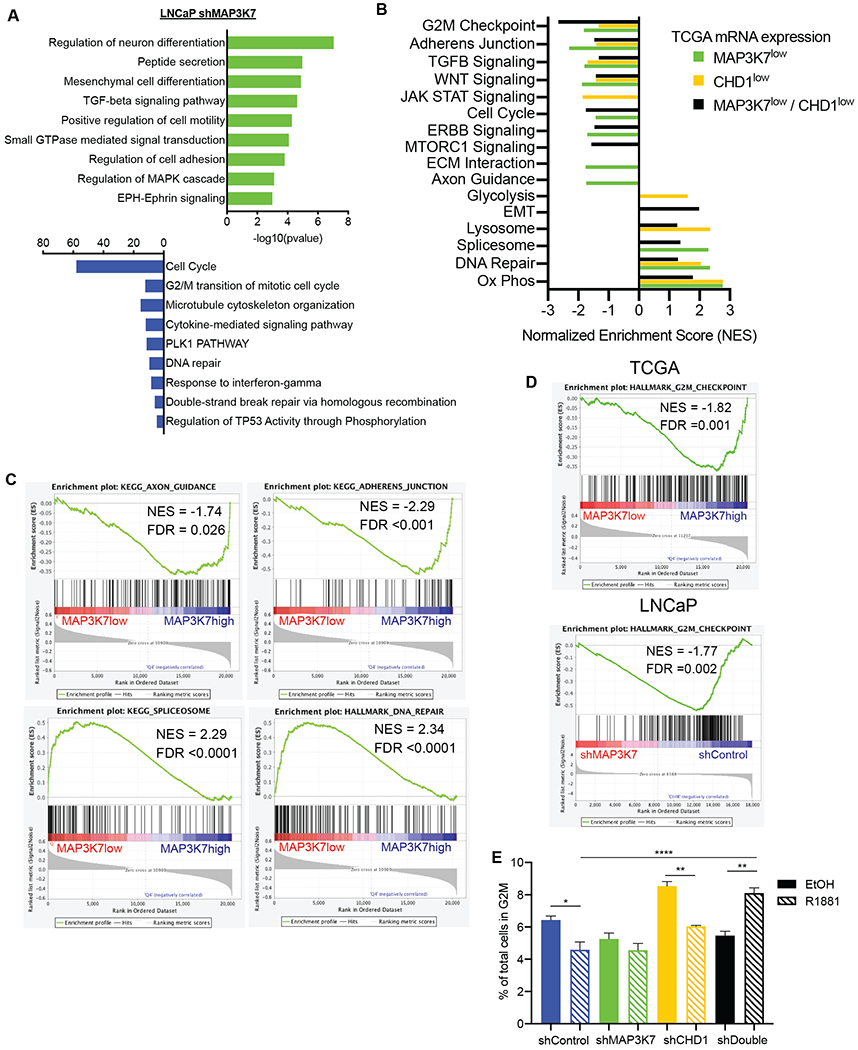
Fig 5. MAP3K7 loss alters cell adhesion, spliceosome, and cell cycle pathways.

(A) Pathway enrichment analysis for LNCaP shMAP3K7 versus shControl (+ R1881) RNA-Seq changes using Metascape (28). (B) Summary of GSEA results comparing TCGA cases with lower quartile mRNA expression of MAP3K7, CHD1 or both versus cases with upper quartile expression of respective groups. Nominal p-value <0.05 for all enrichments included. (C) GSEA plots of signatures particularly enriched in TCGA cases with low versus upper quartile expression of MAP3K7. (D) GSEA plots of the G2M signature in TCGA MAP3K7 low versus high cases and LNCaP shMAP3K7 versus shControl cells (+R1881). (E) Flow cytometry cell cycle analysis of indicated LNCaP cells after 48 hours in steroid-depleted medium ± 1 nM R1881 showing percent of total cells in G2M (n=3). Data represent mean ± SEM. Log-rank Mantel-Cox test (A, B), One-way ANOVA with Tukey’s multiple comparisons test (G); *=p<0.05; **=p<0.01; ***=p<0.001; ****=p<0.0001.
